This allows an inspection of the entire JSON document that was indexed.
Collect Raw Data Points
- Go to Dashboard :: Discover.
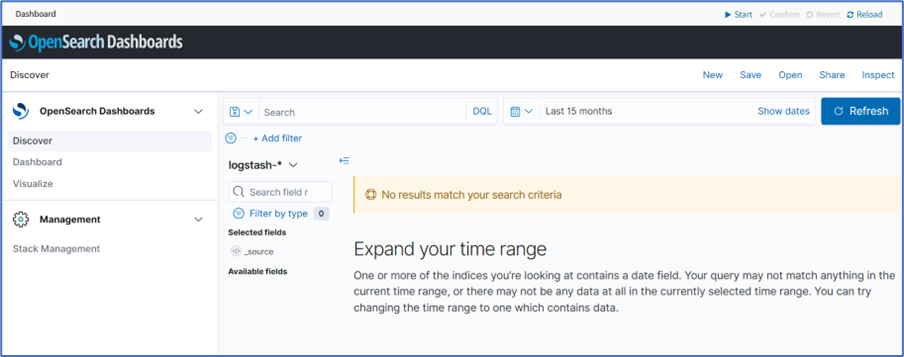
- Next to the index name, click the Down-arrow. On the drop-down, select the Index Pattern:
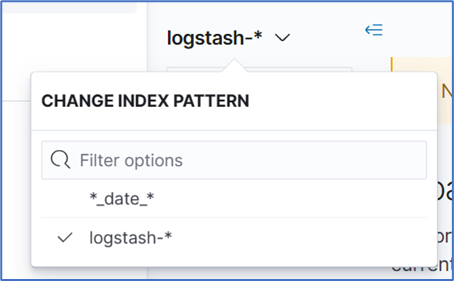
- logstash-* (contains monitored data)
- *_date_*(contains event notifications)
- logstash-* (contains monitored data)
- Adjust the time frame as needed. By default, all displayed data is collected within the defined time frame.
- Use Search to find a specific device or data point.
- Verify that data points were collected.
- Inspect the available fields.NOTECollected data is buffered before stored. it may take up to a few minutes for data to display. If the data source produces a lot of content, buffers quickly fill up.