Go to Dashboard side-tab, list of Dashboards. Click a pencil icon to edit that dashboard. 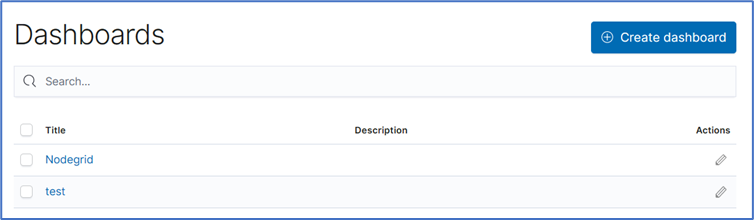
Options
Provides visual display options. 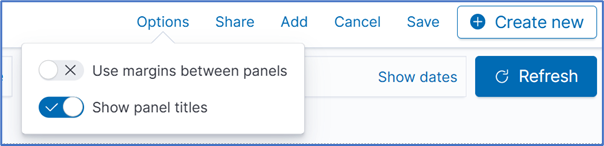
Share
Opens Share dialog options of the current saved search. 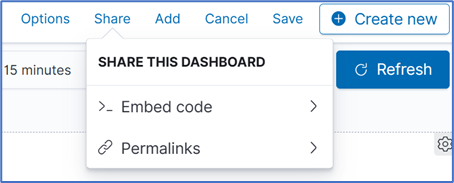
Add
Displays Add Panels dialog. 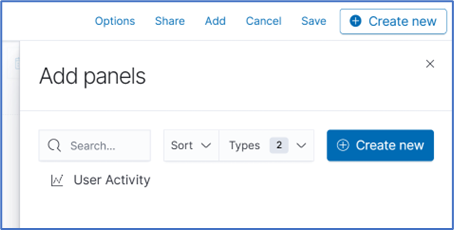
Cancel
Displays Discard changes to Dashboard dialog. 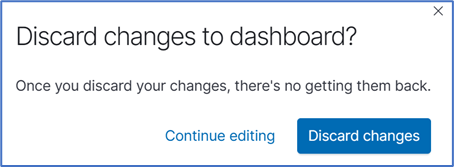
Save
Displays Save dashboard dialog. 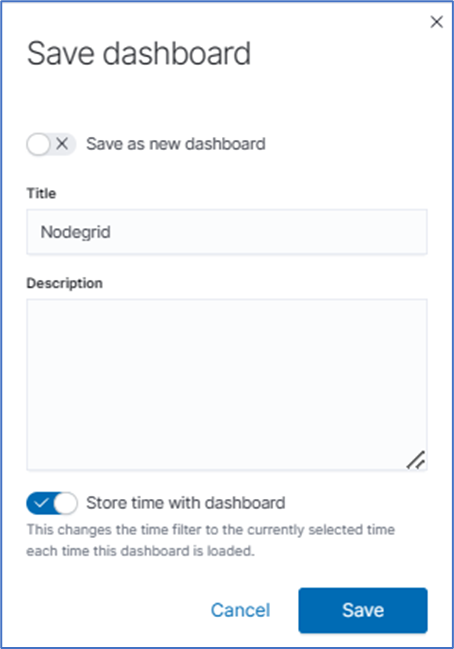
Open
Displays Open search dialog. 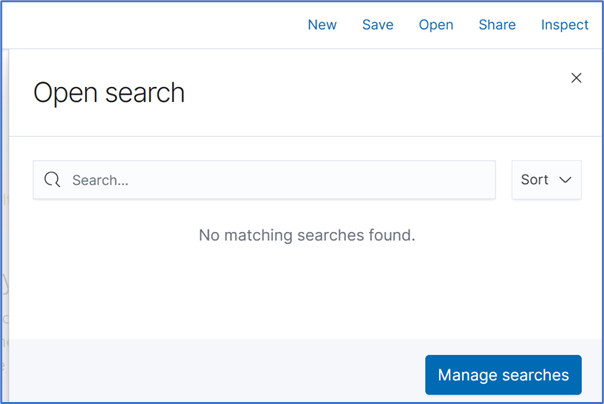
Create New
Displays New Visualization dialog. 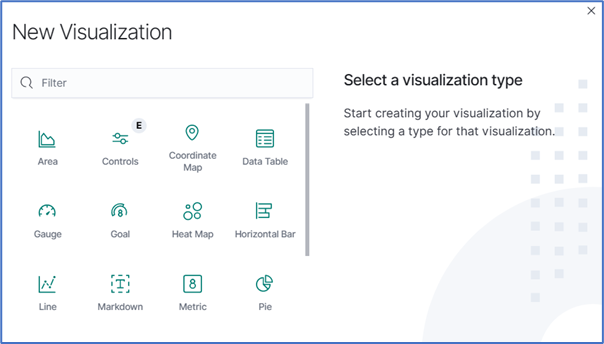
Refresh
How often the results are checked and shown in the display.
Quick select button
Quick options to select a relative time frame to current time. 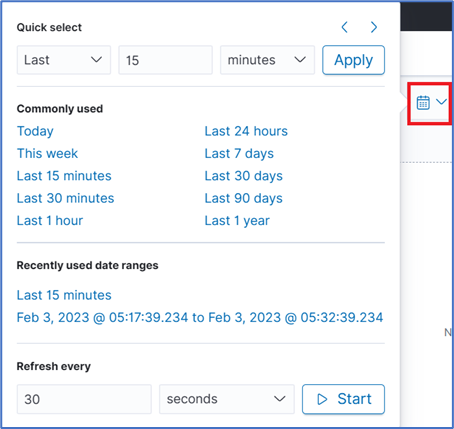
Relative Time
Click to customize time frames of data in panels. Click Update when done. 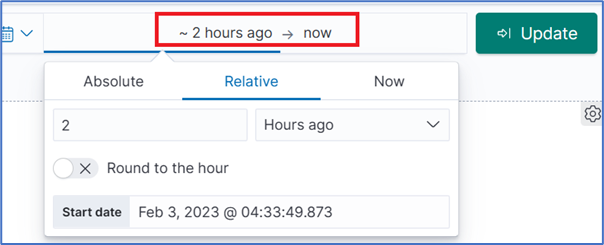
Search bar
Enter search criteria to locate details. Search expressions are used to select/limit data points on the visualization. They can be used as a filter for the whole visualization, or as a filter for the whole dashboard.
Search expressions are not restricted to data point fields. An expression can also refer to fields associated with the device (type, IP address, groups, custom fields, and more). For example, to collect current from each outlet in a selection of Rack PDUs, use one custom field “rack:abc” with another custom field “rack:xyz”. Here are some search examples:
- host:"ServertechPDU"
- collectd_type:”power”
- type_instance:”AA1”
- collectd_type:”power” AND type_instance:”AA1”