Diagnostic Data tool
- 04 Dec 2023
- 1 Minute to read
- Print
- DarkLight
- PDF
Diagnostic Data tool
- Updated on 04 Dec 2023
- 1 Minute to read
- Print
- DarkLight
- PDF
Article summary
Did you find this summary helpful?
Thank you for your feedback
This tool creates a report on the system status of the Nodegrid device. The contents help investigate the device's functionality. A series of commands output the state of the system, collect various log files, and copy the important configuration files. The output compacted file helps debug the system in case of any error or unexpected behavior.
The generated file is saved at:
/home/admin/logs/collection_nodegrid_XXXX-XX-XX_XX-XX-X.tar.gz 
Step 1 – Initiate Diagnostic Data
This runs the Diagnostic Data tool. The results are accessible in the File System or in the File Manager tool.
- Go to Systems :: Toolkit.
- Click the Diagnostic Data icon.
- (Optionally) Uncheck the Apply Masking to Sensitive Information box to not mask the sensitive information in case support needs raw data for troubleshooting.
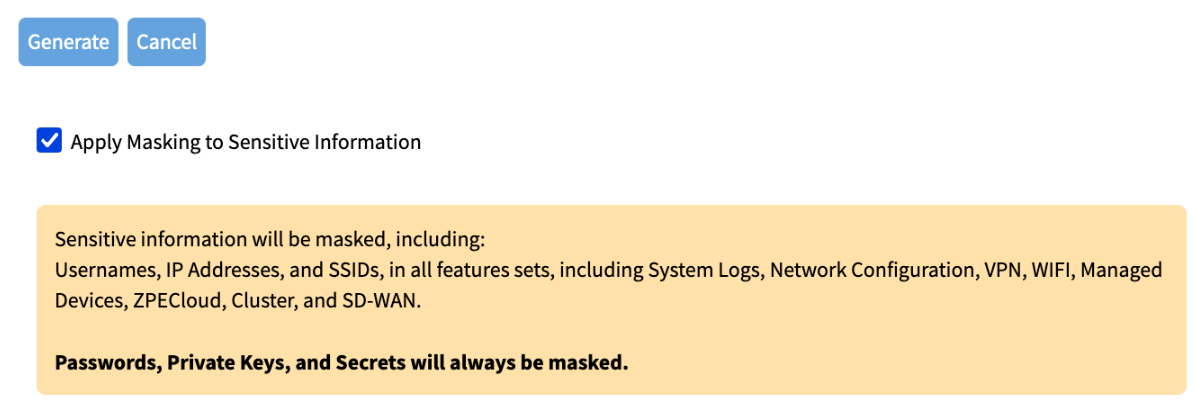
- Click Generate.
- The tool will run the diagnostics.
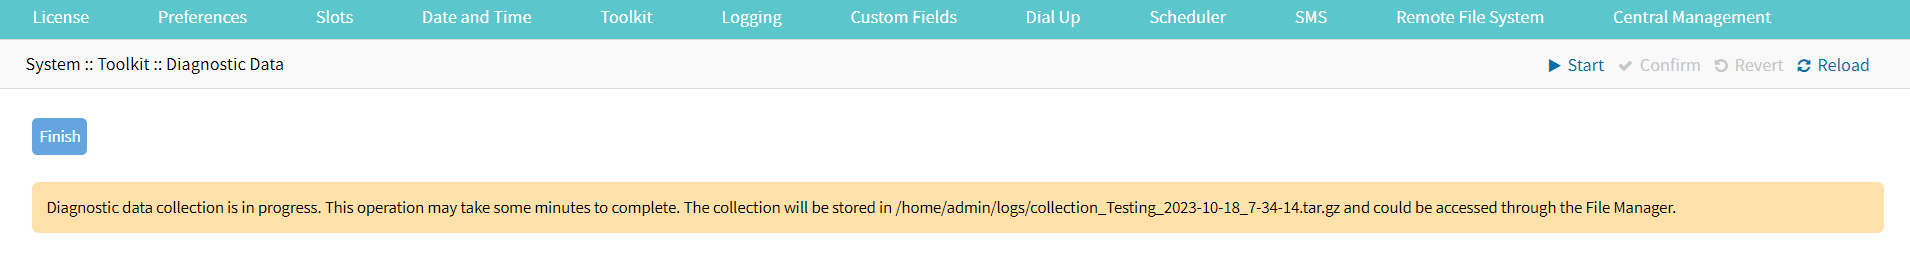
- When done, click Finish (returns to the Toolkit page).


Step 2 – Access the Diagnostic Data Results
(Admin privileges required.)
- Go to System :: Toolkit.
- Click the File Manager icon.
- Go to folder: /Home/admin_home/logs.
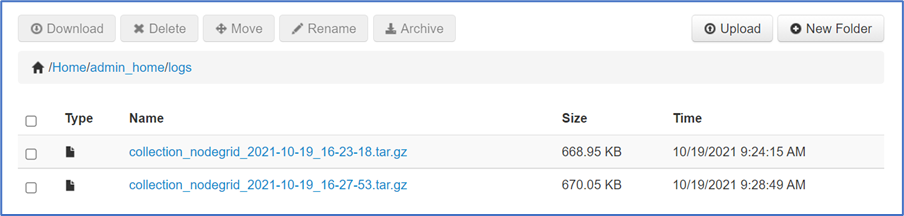
- Locate the tarball and select the checkbox.
- Click Download.

Review the file, as needed.
Was this article helpful?