This presents information usage details. The sub-tabs provide read-only information.
System Check sub-tab
Availability
The System Check sub-tab is available from Nodegrid 6.0.26 release onwards.
Troubleshooting
For information on how to troubleshoot potential issues raised by system check, see the How To Guide titled “How to Troubleshoot System Check Issues”.
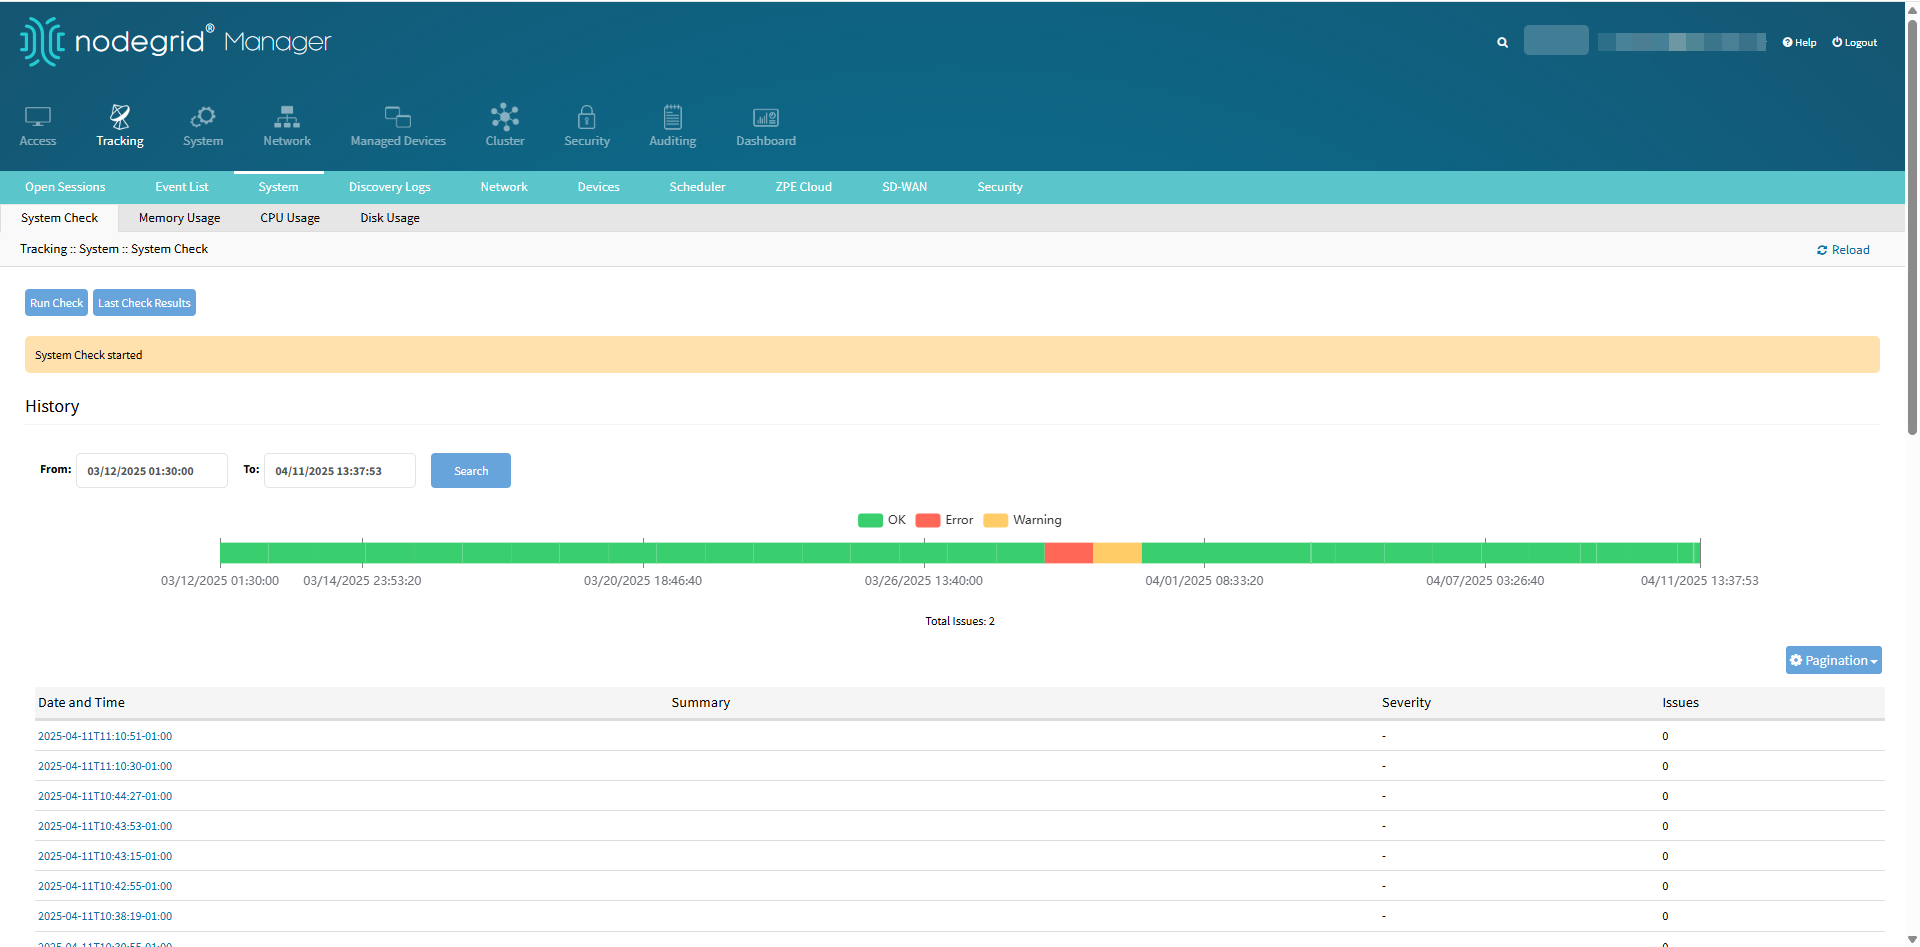
The Nodegrid System Check feature enables you to monitor the health of your system more closely. This page gives you better visibility into any warnings or potential failures detected during the most recent system check. When an issue of severity “Warning” or “Error” is found, a banner appears at the top as the notification.
.png)
This banner includes a direct link to the System Check Tracking page. Clicking on this link navigates to the Tracking:: System:: System Check page. Use this page to review details and take appropriate action.
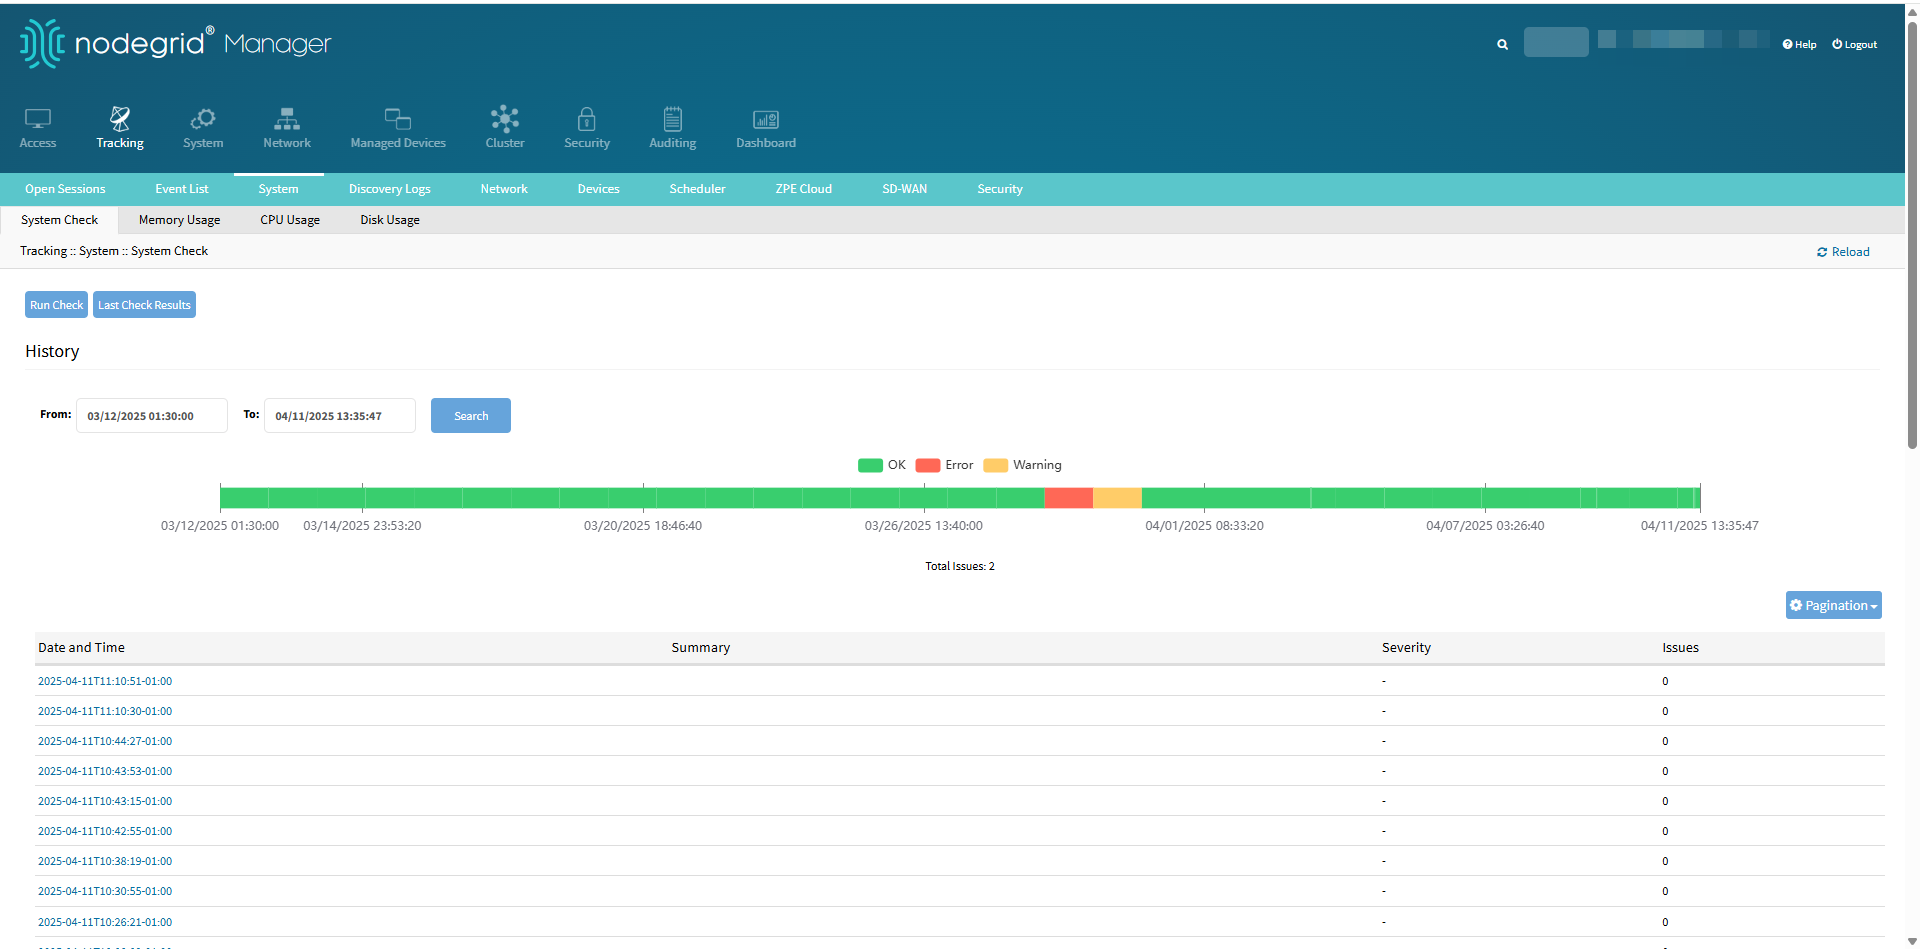
The System Check Tracking page displays a chart where each block represents a single system check run.
Each block is color-coded to reflect the result of the check. The possible colors are:

Green (OK) – The system check was completed successfully with no errors.
Blue (Info) — The system check was completed successfully and raised informational logs.
Yellow (Warning) – The system check was completed with warnings.
Red (Error) – The system check detected one or more errors.
Grey (No Data) - No system check data is available.
Hover over any block to see details such as the date the check was performed and the status of that specific run.
You can also search for system checks by a specific date range using the From and To fields to view results within that selected period.
The System Check Tracking page also provides the same information in a table format. The table includes the following details for each system check run:
Date – When the system check was performed.
Summary – A brief description of any issues detected during the check. If no issues were found during a run, the summary field will be empty, and the error count will be zero.
Error Count – The number of errors identified.
Click Run Check to trigger a new system check instantly. Review the red bars in the chart to identify runs where issues were detected. Click on a specific run (in the chart or table) to view detailed information about the errors and warnings found during that check.
If needed, click Last Check Results to review the in the latest system check. This is same as clicking on the latest block in the chart. Doing this drills down the more detailed information about the selected system check as shown in the following diagram.
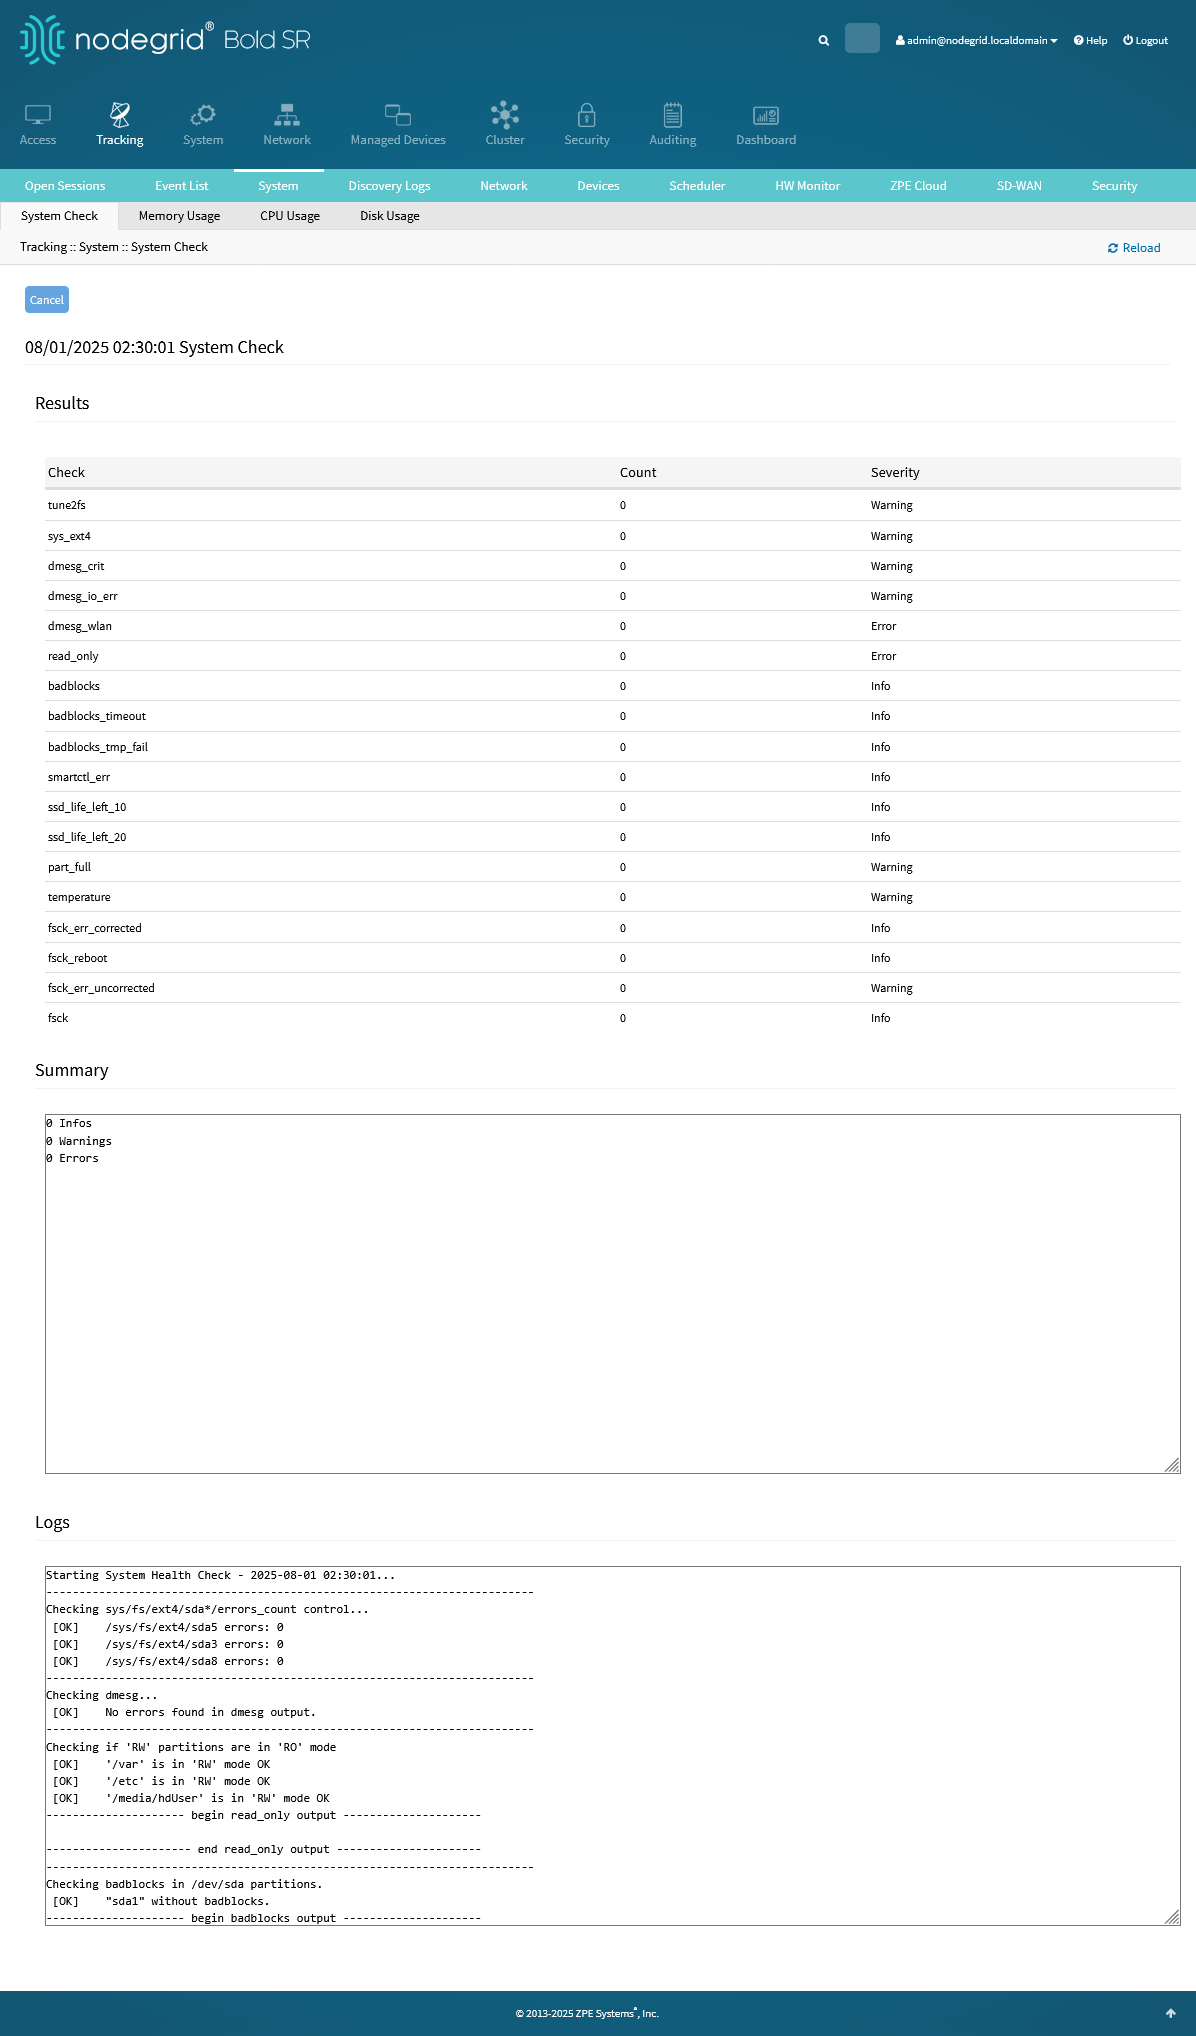
The Results table shows three columns:
Check: the command identifier
Count: how many occurrences of potential issues were found by that command in this system check run
Severity: if any occurrences are found, this is the maximum severity of issues associated with this command
The Summary text area shows a summary of all the potential issues raised by this system check run, and the full detailed output is shown in the Logs text area.
System Check Tracking CLI
Run the command system_check_history to track the system check history. Following is an example of system check history and the commands used during the system check.
[admin@nodegrid /]# show /system/system_check_history/
  date and time              summary                       severity
  =========================  ============================  ========
  2025-08-01T02:30:01-00:00                                -
  2025-07-31T02:30:01-00:00                                -
  2025-07-30T02:30:01-00:00                                -
  2025-07-29T02:30:01-00:00  File system errors corrected  Info
  2025-07-02T13:58:43-00:00  No Data                       -

[admin@nodegrid /]# show /system/system_check_history/2025-07-29T02:30:01-00:00
  check                 count  severity
  ====================  =====  ========
  tune2fs               0      Warning
  sys_ext4              0      Warning
  dmesg_crit            0      Warning
  dmesg_io_err          0      Warning
  dmesg_wlan            0      Error
  read_only             0      Error
  badblocks             0      Info
  badblocks_timeout     0      Info
  badblocks_tmp_fail    0      Info
  smartctl_err          0      Info
  ssd_life_left_10      0      Info
  ssd_life_left_20      0      Info
  part_full             0      Warning
  temperature           0      Warning
  fsck_err_corrected    1      Info
  fsck_reboot           0      Info
  fsck_err_uncorrected  0      Warning
  fsck                  0      Info
The detailed logs can be consulted in the directory /var/local/system_check through admin shell:
[admin@nodegrid /]# shell head /var/local/system_check/system_check.log-20250801_023001
Starting System Health Check - 2025-08-01 02:30:01...
--------------------------------------------------------------------------
Checking sys/fs/ext4/sda*/errors_count control...
 [OK]    /sys/fs/ext4/sda5 errors: 0
 [OK]    /sys/fs/ext4/sda3 errors: 0
 [OK]    /sys/fs/ext4/sda8 errors: 0
--------------------------------------------------------------------------
Checking dmesg...
 [OK]    No errors found in dmesg output.
--------------------------------------------------------------------------
Refer to the section How to Troubleshoot System Check Issues on identifying and resolving common issues encountered during system checks.
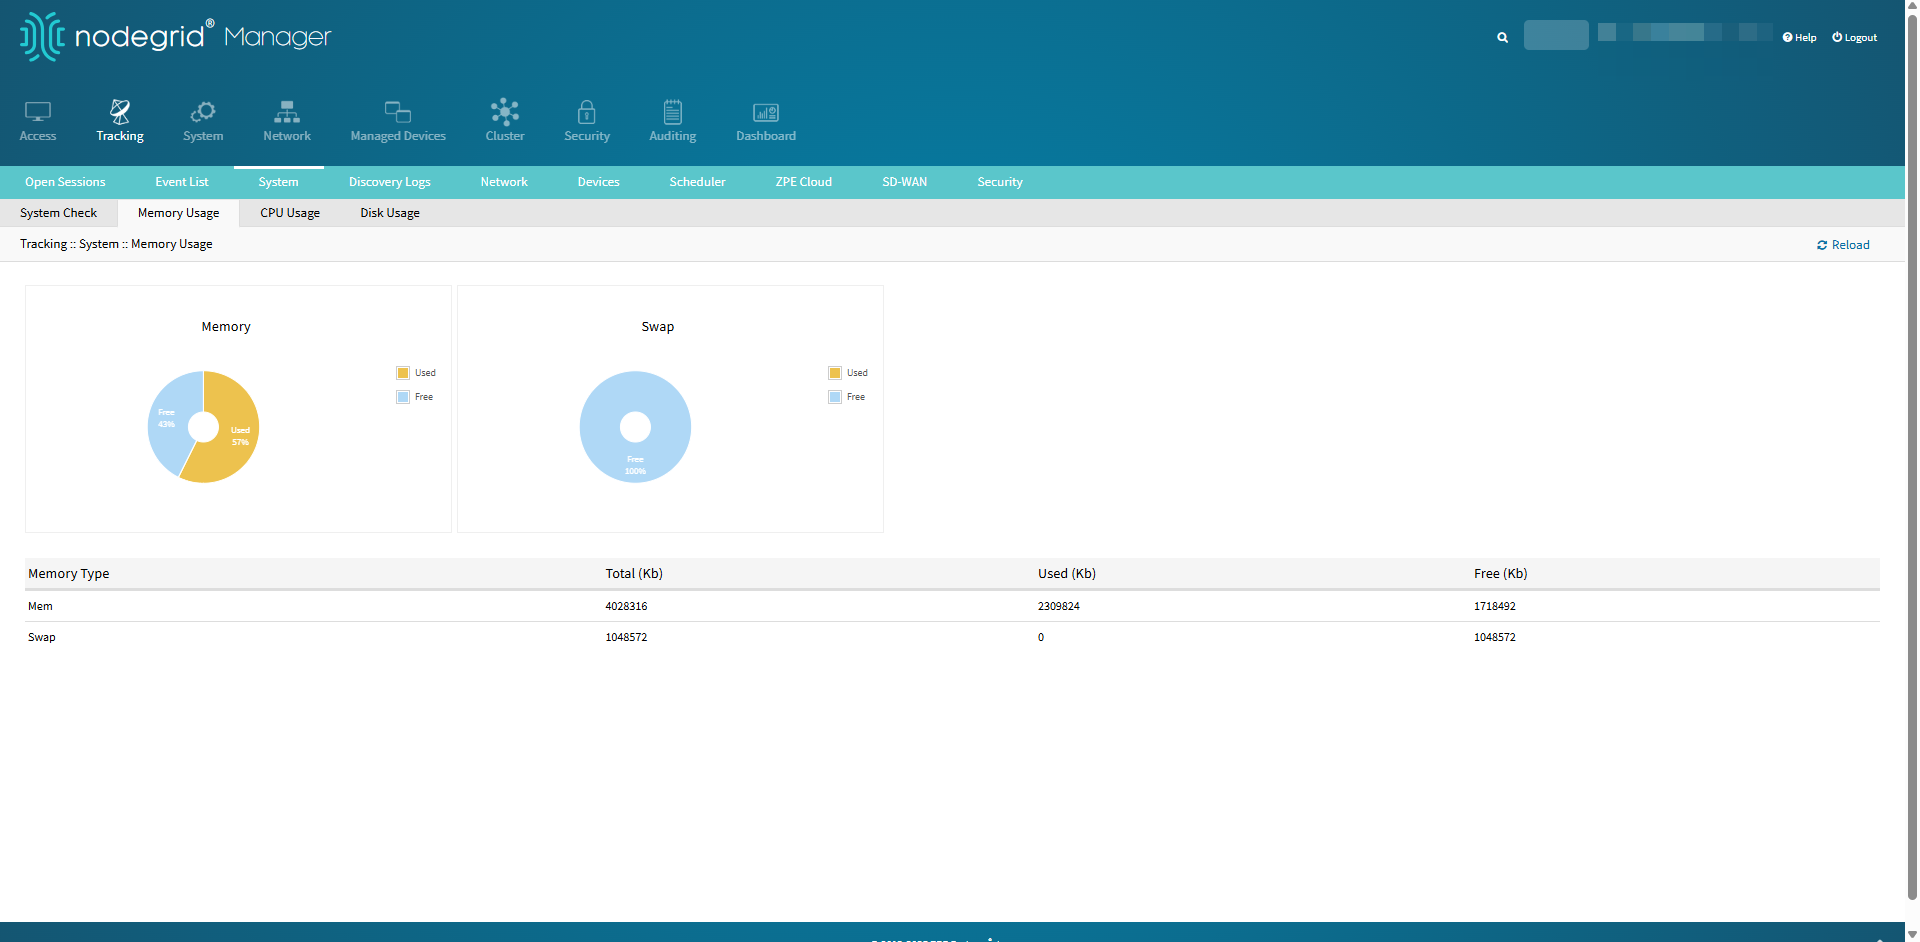
Memory Usage sub-tab
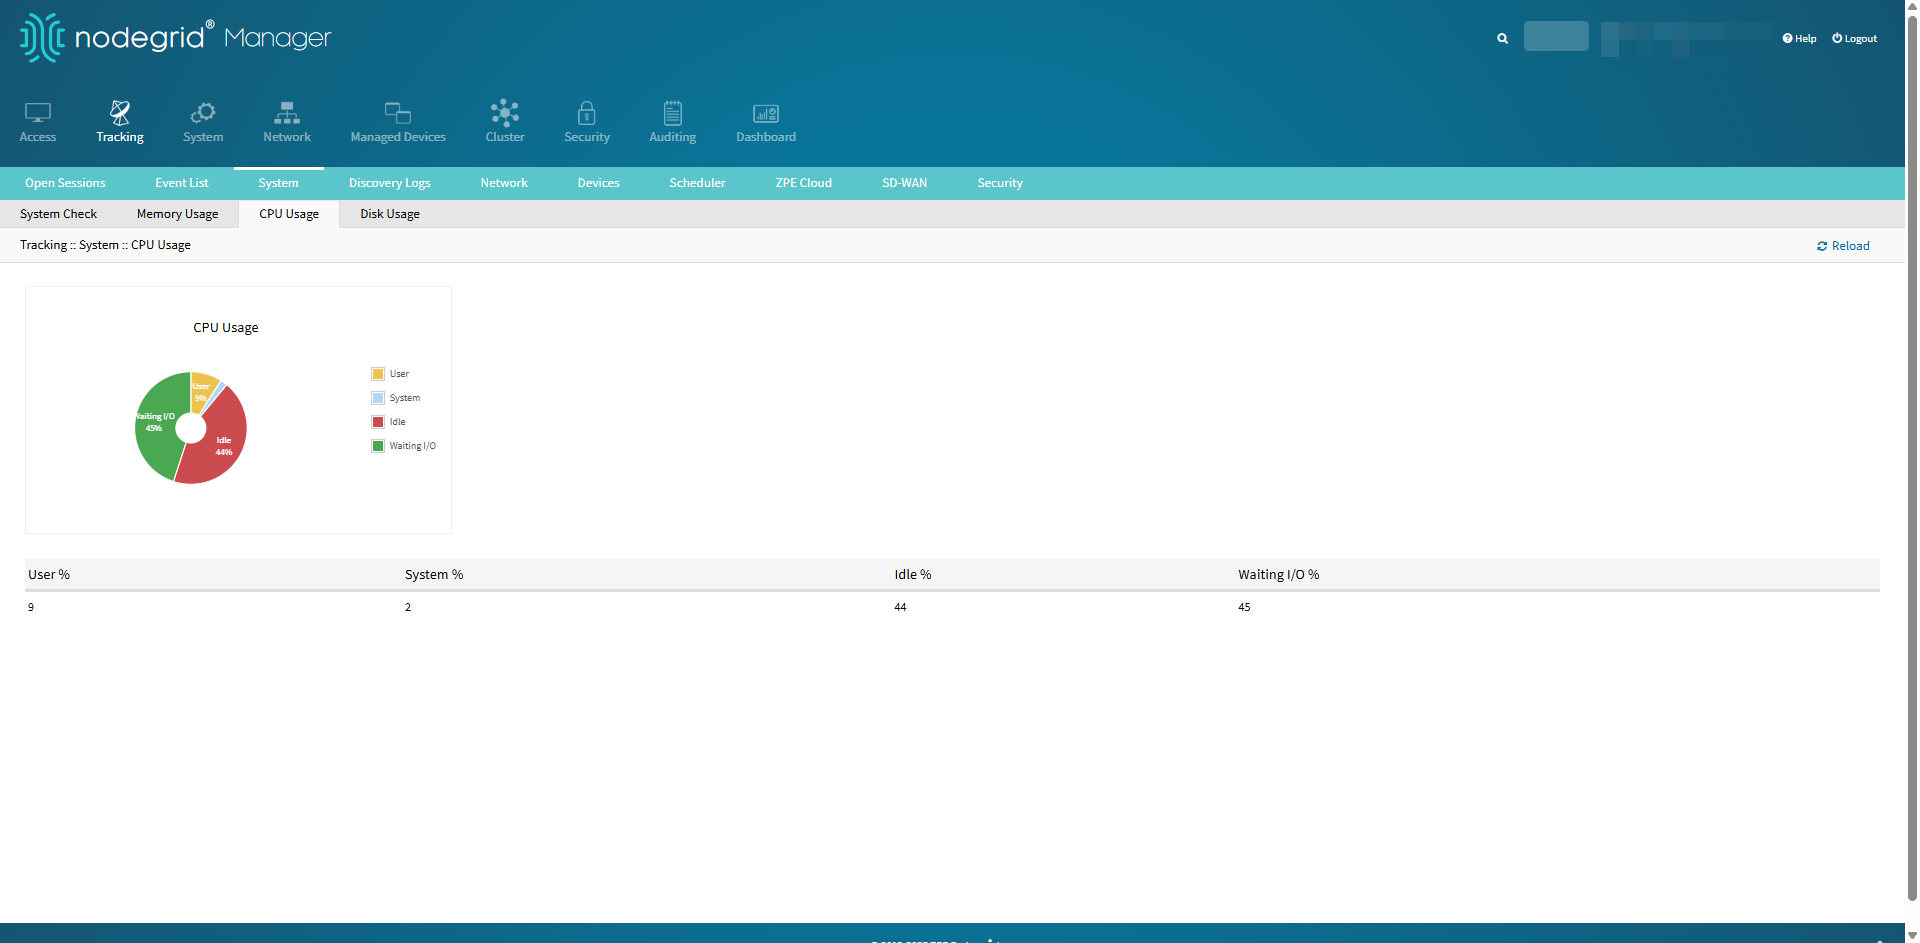
CPU Usage sub-tab
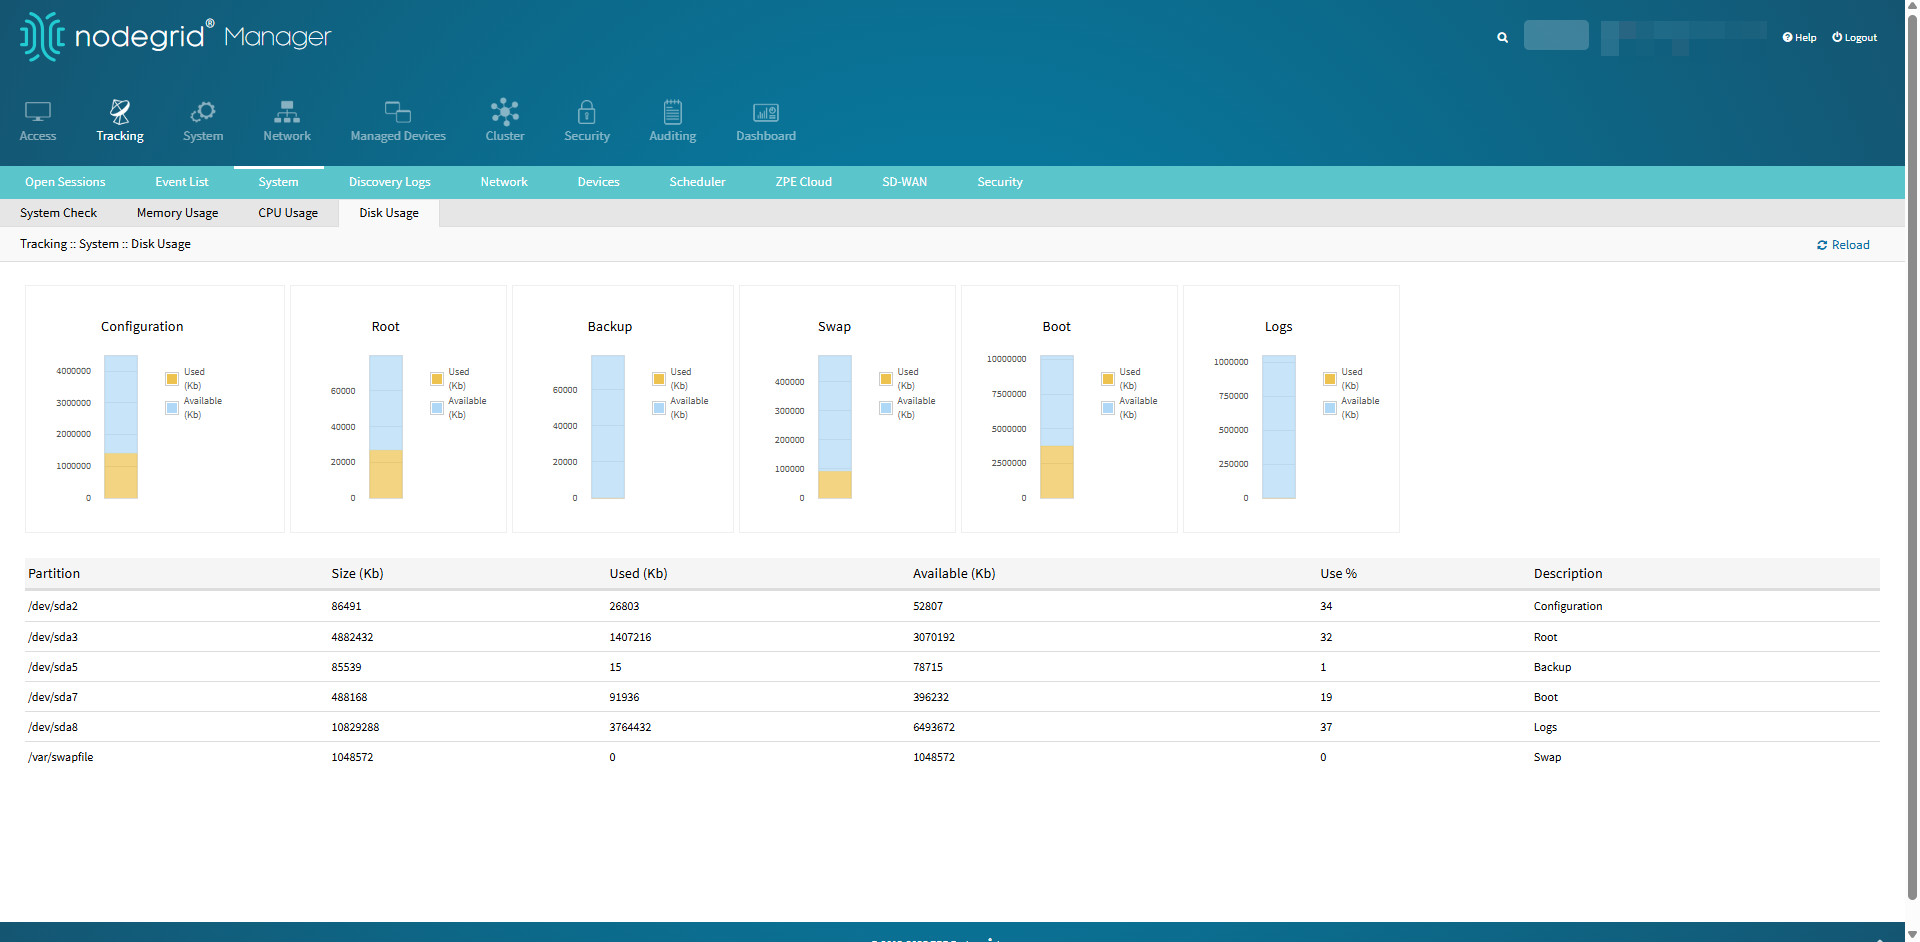
Disk Usage sub-tab