Available Plugins
- 12 Apr 2023
- 19 Minutes to read
- Print
- DarkLight
- PDF
Available Plugins
- Updated on 12 Apr 2023
- 19 Minutes to read
- Print
- DarkLight
- PDF
Article summary
Did you find this summary helpful?
Thank you for your feedback
The following plugins provide details (graphics, reports) on the Nodegrid Data Lake application.
ConnTrack
This tracks the number of entries in the Linux connection tracking table.
Arguments
None
Example
Collect usage of the entire CPU.
<Plugin conntrack>
</Plugin>
CPU (Usage, State)
The CPU plugin collects CPU usage metrics. By default, CPU usage is reported as Jiffies, depending on the cpu type. Two aggregations are available:
- Sum, per-state (CPUs installed in the system)
- Sum, per-CPU (non-idle states of a CPU)
The two aggregations can be combined, leading to collectd only emitting a single "active" metric for the entire system. When an aggregation (or both) is enabled, the cpu plugin reports a percentage, rather than Jiffies. In addition, metric percentages are reported for: individual, per-state, per-CPU.
Arguments
ReportByState <Boolean>
When true (default), reports per-state metrics, i.e., "system", "user" and "idle". When false, aggregates (sums) all non-idle states into one "active" metric.
ReportByCpu <Boolean>
When true (default), reports per-CPU (per-core) metrics. When false, reports only global sum of CPU states.
ValuesPercentage <Boolean>
To be available, ReportByCpu and ReportByState must be true – reports metrics as Jiffies. In the un-aggregated (per-CPU, per-state) mode, percentage values are reported.
ReportNumCpu <Boolean>
When true, reports the number of available CPUs (default: false).
ReportGuestState <Boolean>
When true, reports "guest" and "guest_nice" CPU states (default: false).
SubtractGuestState <Boolean>
Only used if ReportGuestState is true. "guest" and "guest_nice" are included in respectively "user" and "nice". If true, "guest" is subtracted from "user". "guest_nice" is subtracted from "nice" (default: true).
Example 1 – CPU Usage
Collect usage of the entire CPU.
<Plugin cpu>
  ReportByCpu false
  ReportByState false
  ValuesPercentage false
  ReportNumCpu false
  ReportGuestState false
  SubtractGuestState false
</Plugin>
Create Visualization, Example 1
Graph
- Chart Type: Area
- Mode: Normal
Filters
- Plugin - is – cpu
- serial_number - is - <serial-number
Y-Axis
- Aggregation: average
- Field: value
- Label: Jiffies
X-Axis
- Sub aggregation: Data histogram
- Field: time
- Minimum interval: Auto
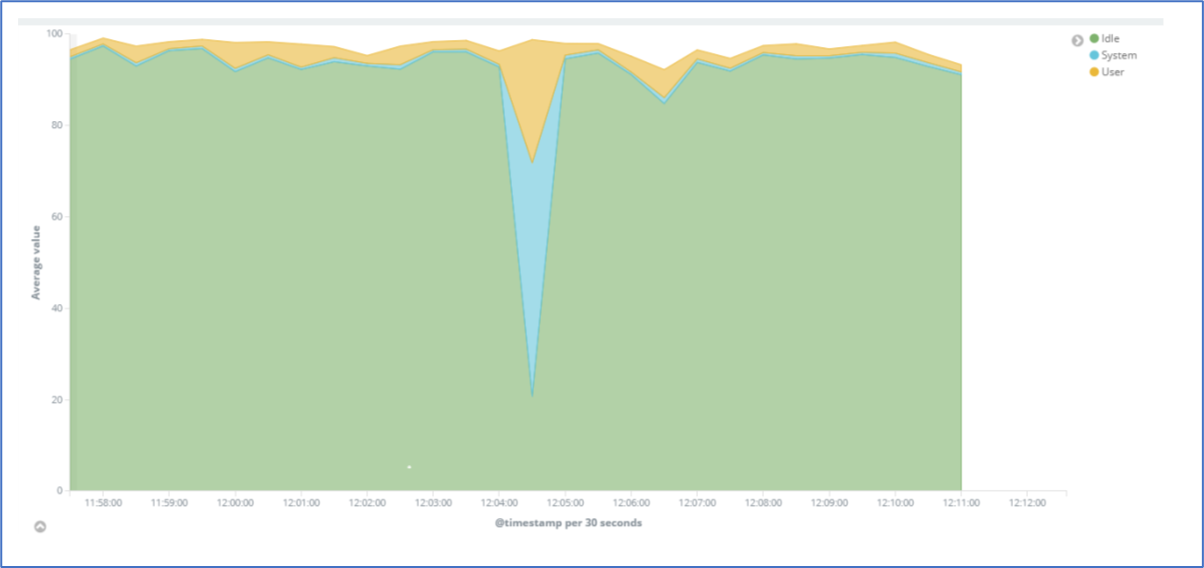
Example 2 CPU usage by state
Visualize CPU usage by state, stacking system, user and idle states.
<Plugin cpu>
  ReportByCpu true
  ReportByState true
  ValuesPercentage true
  ReportNumCpu false
  ReportGuestState false
  SubtractGuestState false
</Plugin>
Create Visualization, Example 2
Graph
- Chart type: Area
- Mode: Stacked
Filters
- plugin - is – cpu
- serial_number - is - <serial-number>
Y-Axis
- Aggregation: average
- Field: value
Split series
- Aggregation: Filters
- Filter 1: typeinstance:idle
- Filter 2: typeinstance:user
- Filter 3: typeinstance:system
X-Axis
- Sub aggregation: Data histogram
- Field: time
- Minimum interval: Auto
 Curl
Curl
 Curl
CurlThis plugin uses libcurl to read files and then parses them according to the configuration. The cURL library reads web pages via HTTP. Many protocol handlers are available – reading via SSH or from FTP as well as local access via file://.
Arguments
URL <String>
URL of the web site to retrieve. Since a regular expression is used to extract information from this data, non-binary data is a big plus.
User Name <String>
Username to use if authorization is required to read the page.
Password <String>
Password to use if authorization is required to read the page.
Digest <Boolean>
Enable HTTP digest authentication.
VerifyPeer <Boolean>
Enable or disable peer SSL certificate verification. See http://curl.haxx.se/docs/sslcerts.html for details (default: enabled).
VerifyHost <Boolean>
Enable or disable peer host name verification. If enabled, the plugin checks if the Common Name or a Subject Alternate Name field of the SSL certificate matches the host name provided by the URL option. If this identity check fails, the connection is aborted. Obviously, only works when connecting to an SSL-enabled server. Default: enabled.
CACert file <String>
File of one or more SSL certificates. To use HTTPS, this is needed. The CA certificates bundled with libcurl and are applied depend on the distribution.
Header <String>
HTTP header to add to the request. Multiple headers are added if this option is specified more than once.
Post Body <String>
Specifies the HTTP operation should be POST instead of GET. The complete data to be posted is given as the argument. This option needs to be accompanied by a Header option to set an appropriate Content-Type for the post body (i.e., to application/x-www-form-urlencoded).
MeasureResponseTime <Boolean>
Measure response time for the request. If this setting is enabled, Match blocks (see below) are optional (default: disabled).
IMPORTANT
Requests are aborted if taken too long to complete. Adjust Timeout accordingly. Use MeasureResponseTime to report slow request. This option is similar to enabling the TotalTime statistic, but is measured by collectd instead of cURL.
MeasureResponseCode <Boolean>
Measure response code for the request. If is enabled, Match blocks (see below) are optional. Default: disabled.
<Statistics>
One Statistics block can be used to specify cURL statistics to be collected for each request to the remote web site. See "cURL Statistics" above for details. If enabled, Match blocks (see below) are optional.
<Match>
One or more Match blocks that define how information is matched in the data returned by libcurl. The cURL plugin uses the same infrastructure as the tail plugin. See the documentation of the tail plugin below on how matches are defined. If the MeasureResponseTime or MeasureResponseCode options are set to true, Match blocks are optional.
Timeout Milliseconds <Integer>
The Timeout option sets the overall timeout for HTTP requests to URL, in milliseconds. By default, the configured Interval is used to set the timeout. Prior to version 5.5.0, there was no timeout and requests could hang indefinitely. To use this legacy behavior, set Timeout = 0.
If Timeout is 0 or bigger than the Interval, each slow network connection stalls one read thread. Adjust the ReadThreads global setting to prevent blocking other plugins.
Example: Curl – Office 365
Check if Office 365 is up and displays response code.
<Plugin curl>
  <Page "office365">
    URL "http://office365.com/"
    MeasureResponseTime true
    MeasureResponseCode true
    Timeout 10000 # 10 seconds
  </Page>
</Plugin>
Disk
The Disk plugin collects performance statistics of hard-disks and partitions.
Arguments
Disk Name <String|Regex>
Select the disk Name. Whether it is collected or ignored depends on the IgnoreSelected setting, see below. As with other plugins that use the daemon's ignorelist functionality, a string that starts and ends with a slash is interpreted as a regular expression.
IgnoreSelected <Boolean>
Sets whether selected disks, i. e. the matches by any of the Disk statements, are ignored or if all other disks are ignored. The behavior (hopefully) is intuitive: If no Disk option is configured, all disks are collected. If at least one Disk option is given and no IgnoreSelected or set to false, only matching disks are collected. If IgnoreSelected = true, all disks are collected except those that match.
UseBSDName <Boolean>
Whether to use the device's "BSD Name", on Mac OS X, instead of the default major/minor numbers. Requires collectd to be built with Apple's IOKitLib support.
UdevNameAttr <String>
Attempt to override disk instance name with the value of a specified udev attribute when built with libudev. If the attribute is not defined for the given device, the default name is used.
Example
Collect statistics for all partitions.
<Plugin disk>
  Disk "/sda[0-9]/"
  IgnoreSelected false
</Plugin>
Create Visualization
Graph
- Chart type: Line
- Mode: Normal
Filters
- plugin - is – disk
- type.keyword - is - disk_time
Y-Axis
- Aggregation: average
- Field: value
- Custom label: Avg.Time/Operation (ms)
Split series
- Aggregation: Terms
- Field: plugininstance.keyword
X-Axis
- Sub aggregation: Data histogram
- Field: time
- Minimum interval: Auto

Exec
The Exec plugin executes bash scripts and reads values back that are printed to STDOUT by that program. This allows the daemon to be extended in an easy, flexible way.
Arguments
Exec "system-user" "/path/to/script" "arg0" "arg1"
Example 1
Collect statistics for all partitions.
<Plugin exec>
  Exec "collectd-user" "/home/admin/custom_df.sh"
</Plugin>
NOTE
The DF plugin from collectd is not currently installed on NG v5.0, but it is possible to obtain the statistics with the following exec scripts.
Create a file named custom_df.sh under the /home/admin/ directory of the device and add the following script:
HOSTNAME="${COLLECTD_HOSTNAME:-nodegrid}"
INTERVAL="${COLLECTD_INTERVAL:-10}"

# Collectd metric output pattern
# PUTVAL "<hostname>/<plugin-name>-<plugin-instance>/<type>-<type-instance>" interval=<interval> N:<value>
# Type = [gauge, absolute, derive, counter]

df | awk -v hostname="$HOSTNAME" -v interval="$INTERVAL" '
$0 !~ /\/dev\/sda[0-9]/ { next }
    {split($1, filesystem, "/")}
    {sub(/%/, "", $5)}
    {print "PUTVAL \""hostname"/custom_df-"filesystem[3]"/gauge-total\" interval="interval" N:"$2}
    {print "PUTVAL \""hostname"/custom_df-"filesystem[3]"/gauge-used\" interval="interval" N:"$3}
    {print "PUTVAL \""hostname"/custom_df-"filesystem[3]"/gauge-available\" interval="interval" N:"$4}
    {print "PUTVAL \""hostname"/custom_df-"filesystem[3]"/gauge-percent-used\" interval="interval" N:"$5}
'
sleep "$INTERVAL"
Create Visualization, Example 1
Graph
- Chart type: Line
- Mode: Normal
Filters
- plugin - is - custom_df
- typeinstance.keyword - is - percentage-used
Y-Axis
- Aggregation: average
- Field: value
- Custom label: % Usage
Split series
- Aggregation: Terms
- Field: plugininstance.keyword
X-Axis
- Sub aggregation: Data histogram
- Field: time
- Minimum interval: Auto

Example 2
This collects statistics from smartctl.
<Plugin exec>
  Exec "collectd-user" "/home/admin/custom_smartctl.sh"
</Plugin>
The smartctl plugin from collectd is not installed on NG5.0, but metrics can be collected from smartctl with the following script.
Create a file named custom_smartctl.sh under /home/admin/ directory of the device and add the following script:
HOSTNAME="${COLLECTD_HOSTNAME:-nodegrid}"
INTERVAL="${COLLECTD_INTERVAL:-10}"

# Collectd metric output pattern
# PUTVAL "<hostname>/<plugin-name>-<plugin-instance>/<type>-<type-instance>" interval=<interval> N:<value>
# Type = [gauge, absolute, derive, counter]


sudo /usr/sbin/smartctl -f old -H -A /dev/sda -C | awk -v hostname="$HOSTNAME" -v interval="$INTERVAL" '
{
        if ($0 ~ /^SMART overall-health self-assessment test result/){
                if ($0 ~ /PASSED/){
                        print "PUTVAL \""hostname"/custom_smartctl-sda/gauge-health-result\" interval="interval" N:1"
                        next
                }
                else{
                        print "PUTVAL \""hostname"/custom_smartctl-sda/gauge-health-result\" interval="interval" N:0"
                        next
                }
        }
        else{
                if ($3 ~ /^0x/){
                        if ($2 == "Later_Bad_Block" ||
                            $2 == "Power_On_Hours" ||
                            $2 == "Power_Cycle_Count" ||
                            $2 == "Remaining_Lifetime_Perc" ||
                            $2 == "Temperature_Celsius" ||
                            $2 == "Current_Pending_Sector"){
                            print "PUTVAL \""hostname"/custom_smartctl-"$2"/gauge-value\" interval="interval" N:"$4
                            print "PUTVAL \""hostname"/custom_smartctl-"$2"/gauge-worst\" interval="interval" N:"$5
                            print "PUTVAL \""hostname"/custom_smartctl-"$2"/gauge-thresh\" interval="interval" N:"$6
                        }
                }
        }
}
'
sleep "$INTERVAL"
smartctl requires root permission to execute. For security reasons, the Exec plugin (collectd) cannot execute scripts as root. To resolve this, create a user with permissions to use collectd for script executions.
On the device, create a new collectd user.
adduser -s /bin/false collectd-user
usermod -aG sudo collectd-user
On the device, go to /etc/sudoers folder and open the sudoers file. Add the following lines to the end of the file (allows collectd-user to execute only the smartclt command as sudo).
collectd-user ALL=(ALL) !ALL
collectd-user ALL=(ALL) NOPASSWD: /usr/sbin/smartctl -f old -H -A /dev/sda -C
Create Visualization, Example 2
Graph
- Chart type: Line
- Mode: Normal
Filters
- plugin - is - custom_smartctl
- typeinstance.keyword - is - Remaining_Lifetime_Perc
Y-Axis
- Aggregation: average
- Field: value
- Custom label: % Remaining Lifetime
Split series
- Aggregation: Filters
- Filter 1: typeinstance:value
X-Axis
- Sub aggregation: Data histogram
- Field: time
- Minimum interval: Auto

Example 3
Reading air velocity and temperature from USB sensor.
<Plugin exec>
  Exec "collectd-user" "Exec "admin" "/home/admin/usb_sensor.sh"
</Plugin>
This example collects air velocity and air temperature from a sensor connected to an USB port from Nodegrid. Once the USB ports are owned by root, it is necessary to modify permissions to allow the user described on the exec plugin to access the sensor.
The following script must be stored inside the device and the user defined on the configuration must have execution permission:
HOSTNAME="${COLLECTD_HOSTNAME:-nodegrid}"
INTERVAL="${COLLECTD_INTERVAL:-10}"

# Collectd metric output pattern
# PUTVAL "<hostname>/<plugin-name>-<plugin-instance>/<type>-<type-instance>" interval=<interval> N:<value>
# Type = [gauge, absolute, derive, counter]

/usr/bin/python3 - <<EOF
import serial
import os

hostname = os.getenv('HOSTNAME') or 'nodegrid'
interval = os.getenv('INTERVAL') or 10
sensor = "usb_sensor"
sensor_port = "usbS3"

try:
        ser = serial.Serial(port='/dev/usbS3', baudrate=19200, bytesize=serial.EIGHTBITS, parity=serial.PARITY_NONE, stopbits=serial.STOPBITS_ONE)
        if not ser.is_open:
                print('PUTVAL "{0}/{1}-{2}/gauge-air_temperature_success" interval={3} N:{4}'.format(hostname, sensor, sensor_port, interval, 0))
                print('PUTVAL "{0}/{1}-{2}/gauge-air_velocity_success" interval={3} N:{4}'.format(hostname, sensor, sensor_port, interval, 0))
                exit(1)
except:
        print('PUTVAL "{0}/{1}-{2}/gauge-air_temperature_success" interval={3} N:{4}'.format(hostname, sensor, sensor_port, interval, 0))
        print('PUTVAL "{0}/{1}-{2}/gauge-air_velocity_success" interval={3} N:{4}'.format(hostname, sensor, sensor_port, interval, 0))
        exit(1)


# Creating read air temperature request
request_msg = bytearray(4)
request_msg[0] = 0X02                             # read air temperature operation
request_msg[1] = 0X00                             # reserved
request_msg[2] = 0X00                             # reserved
request_msg[3] = request_msg[0] ^ request_msg[1] ^ request_msg[2]      # XOR checksum

ser.write(request_msg)

# read reply
reply_msg_size = 4                                # protocol definition
reply = ser.read(reply_msg_size)

# reply verification
reply_checksum = reply[0] ^ reply[1] ^ reply[2]    # XOR checksum

if reply_checksum == reply[3]:
        # Value convertion to Celsius grades
        temperature = float(0)
        temperature = reply[0] << 8                # reply[0] is Most Significant byte
        temperature |= reply[1]                    # reply[1] is Least Significant byte
        temperature /= 100                         # to Celsius grades conversion

        print('PUTVAL "{0}/{1}-{2}/gauge-air_temperature" interval={3} N:{4}'.format(hostname, sensor, sensor_port, interval, temperature))
        print('PUTVAL "{0}/{1}-{2}/gauge-air_temperature_success" interval={3} N:{4}'.format(hostname, sensor, sensor_port, interval, 1))

else:
        print('PUTVAL "{0}/{1}-{2}/gauge-air_temperature_success" interval={3} N:{4}'.format(hostname, sensor, sensor_port, interval, 0))

# Creating read air velocity request
request_msg = bytearray(4)
request_msg[0] = 0X01                               # read air velocity operation
request_msg[1] = 0X00                               # reserved
request_msg[2] = 0X00                               # reserved
request_msg[3] = request_msg[0] ^ request_msg[1] ^ request_msg[2]      # XOR checksum

ser.write(request_msg)

# read reply
reply_msg_size = 4                                  # protocol definition
reply = ser.read(reply_msg_size)

# reply verification
reply_checksum = reply[0] ^ reply[1] ^ reply[2]     # XOR checksum

if reply_checksum == reply[3]:
        # Value convertion to m/s
        velocity = float(0)
        velocity = reply[0] << 8                 # reply[0] is Most Significant byte
        velocity |= reply[1]                     # reply[1] is Least Significant byte
        velocity /= 1000                         # to m/s conversion

        print('PUTVAL "{0}/{1}-{2}/gauge-air_velocity" interval={3} N:{4}'.format(hostname, sensor, sensor_port, interval, velocity))
        print('PUTVAL "{0}/{1}-{2}/gauge-air_velocity_success" interval={3} N:{4}'.format(hostname, sensor, sensor_port, interval, 1))

else:
        print('PUTVAL "{0}/{1}-{2}/gauge-air_velocity_success" interval={3} N:{4}'.format(hostname, sensor, sensor_port, interval, 0))

EOF

sleep "$INTERVAL"
Interface
The Interface plugin collects information about the traffic (octets per second), packets per second and errors of interfaces (of course number of errors during one second).
Arguments
Interface <String>
Select this interface. By default, these interfaces are collected. For a more detailed description see IgnoreSelected below.
IgnoreSelected <Boolean>
If no configuration is given, the interface-plugin collects data from all interfaces. This may not be practical, especially for loopback- and similar interfaces. Use the Interface-option to pick appropriate interfaces. Sometimes it is easier/preferred to collect all interfaces except a couple excluded interfaces. If IgnoreSelected = true, the effect of Interface is inverted: All selected interfaces are ignored and all other interfaces are collected.
It is possible to use regular expressions to match interface names. If the name is surrounded by /.../ and collectd was compiled with support for regexps. This is useful if there's a need to collect (or ignore) data for a group of interfaces that are similarly named, without the need to explicitly list all of them (especially useful if the list is dynamic).
ReportInactive <Boolean>
When set to false, only interfaces with non-zero traffic is reported. Note that the check is done by looking into whether a package was sent at any time from boot, and the corresponding counter is non-zero. So, if the interface has been sending data in the past since boot, but not during the reported time-interval, it is still reported.
Default = true collects data from all interfaces selected by Interface and IgnoreSelected options.
Example: Interface eth0/eth1
Collect statistics of eth0 and eth1
<Plugin interface>
  Interface "eth0"
  Interface "eth1"
</Plugin>
Load
This plugin collects the system load. The numbers give a rough overview over the utilization of a machine. The system load is defined as the number of runnable tasks in the run-queue and is provided by many operating systems at a one, five, or fifteen minute average.
Arguments
ReportRelative <Boolean>
When enabled, system load, divided by number of available CPU cores, is reported for intervals 1 min, 5 min and 15 min. Default: false.
Example: CPU Load
Collect statistics of eth0 and eth1
<Plugin load>
</Plugin>
LogFile
The LogFile plugin receives log messages from the daemon and writes them to a text file. This plugin can be used to debug the configuration of plugins to make sure collectd is running properly. In order for other plugins to be able to report errors and warnings during initialization, the LogFile plugin should be loaded as the first plugin (or one of the first) in the configuration file.
Arguments
LogLevel <String> [debug | info | notice | warning | err]
ets log-level. If, for example, set to notice, then all events with severity notice, warning, or err will be written to the logfile.
Debug is only available if collectd has been compiled with debugging support.
File <String>
Sets the file to write log messages. The special strings "stdout" and "stderr" can be used to write to the standard output and standard error channels, respectively. This makes sense when collectd is running in foreground- or non-daemon-mode.
Timestamp <Boolean>
Prefix all lines with timestamp. Default: true.
PrintSeverity <Boolean>
When enabled, all lines are prefixed by the severity of the log message, for example "warning". Default: false.
Example
Log collectd info messages to a file.
<Plugin logfile>
  LogLevel info
  File "/home/admin/collectd.log"
  Timestamp true
  PrintSeverity false
</Plugin>
Use this example to ensure the created profile is working properly on the device. Collectd creates file in the home directory of admin user and logs information about the loaded plugins. This file can be retrieved with the device's File Manager.
Memory
Collects physical memory utilization follow the categories below:
- Usage
- Buffered
- Cached
- Free
- slab_recl
- slab_unrecl
Arguments
ValuesAbsolute <Boolean>
Enables or disables reporting of physical memory usage in absolute numbers (i.e., bytes). Default: true.
ValuesPercentage <Boolean>
Enables or disables reporting of physical memory usage in percentages (i.e., percent of physical memory used). Default: false.
This is useful for deploying collectd in a heterogeneous environment in which the sizes of physical memory vary.
Example
Display memory usage with stacked categories:
Create visualization
Graph
- Chart type: Area
- Mode: Stacked
Filters
- plugin - is – memory
- serial_number - is - <serial-number>
Y-Axis
- Aggregation: average
- Field: value
- Custom label: % of memory usage
Split series
- Aggregation: Filters
- Filter 1: typeinstance:free
- Filter 2: typeinstance:used
- Filter 3: typeinstance:buffered
- Filter 4: typeinstance:cached
- Filter 5: typeinstance:slab_unrecl
- Filter 6: typeinstance:slab_recl
X-Axis
- Sub aggregation: Data histogram
- Field: time
- Minimum interval: Auto

Ping
Measures network latency using ICMP echo requests.
Arguments
Host <String>
Host to ping periodically. This option may be repeated several times to ping multiple hosts.
Interval <Float>
Default: 1.0. Sets the interval in which to send ICMP echo packets to the configured hosts. This is not the interval in which metrics are read from the plugin but the interval in which the hosts are "pinged". Therefore, the setting here should be smaller than or equal to the global Interval setting. Fractional times, such as "1.24" are allowed.
Timeout <Float>
Default: 0.9. Time to wait for a response from the host to which an ICMP packet had been sent. If a reply was not received after Seconds value, the host is assumed to be down or the packet to be dropped. This setting must be smaller than the Interval setting above for the plugin to work correctly. Fractional arguments are accepted.
TTL <Integer> [0-255]
Sets the Time-To-Live of generated ICMP packets.
Size <Integer>
Sets the size of the data payload in ICMP packet to specified size (it will be filled with regular ASCII pattern). If not set, default 56 byte long string is used so that the packet size of an ICMPv4 packet is exactly 64 bytes, similar to the behavior of normal ping(1) command.
SourceAddress <String>
Sets the source address to use. host may either be a numerical network address or a network hostname
Device <String>
Sets the outgoing network device to be used. name has to specify an interface name (e. g. eth0). This might not be supported by all operating systems.
MaxMissed <Integer>
Default: -1 (disabled). Trigger a DNS resolve after the host has not replied to Packets. This enables the use of dynamic DNS services (like dyndns.org) with the ping plugin.
Example
Display latency for 2 websites.
<Plugin ping>
        Host "zpecloud.com"
        Host "zpesystems.com"
        Interval 1.0
        Timeout 0.9
</Plugin>
Create visualization
Filters
- plugin - is – ping
- type - is - ping
Y-Axis
- Aggregation: average
- Field: value
- Custom label: ms
Split series
- Aggregation: Terms
- Field: typeinstance.keyword
X-Axis
- Sub aggregation: Data histogram
- Field: time
- Minimum interval: Auto

Process
Collects information about processes of local system. By default, with no process matches configured, only general statistics are collected, such as the number of processes in each state and fork rate.
Process matches can be configured by Process and ProcessMatch options. These may also be a block in which further options may be specified.
The statistics collected for matched processes are: - size of the resident segment size (RSS) - user- and system-time used - number of processes - number of threads - number of open files (under Linux) - number of memory mapped files (under Linux) - io data (where available) - context switches (under Linux) - minor and major page faults.
Arguments
Process <String>
Select more detailed statistics of processes matching this name. Some platforms have a limit on the length of process names. Name must stay below this limit.
ProcessMatch <String>
Select more detailed statistics of processes matching the specified regex (see regex(7) for details). The statistics of all matching processes are summed up and dispatched to the daemon using the specified name as an identifier. This allows one to "group" several processes together. name must not contain slashes.
CollectContextSwitch <Boolean>
Collect the number of context switches for matched processes. Disabled by default.
CollectFileDescriptor <Boolean>
Collect number of file descriptors of matched processes. Disabled by default.
CollectMemoryMaps <Boolean>
Collect the number of memory mapped files of the process. The limit for this number is configured via /proc/sys/vm/max_map_count in the Linux kernel.
(options) CollectContextSwitch and CollectFileDescriptor can be used inside Process and ProcessMatch blocks (affects corresponding match only). Otherwise, this sets the default value for subsequent matches.
Example
Display processes
<Plugin processes>
       CollectFileDescriptor false
       CollectContextSwitch false
       CollectMemoryMaps false
       CollectDelayAccounting false
</Plugin>
Protocols
Collects information about various network protocols, such as IP, TCP, UDP.
Arguments
Value <Protocol:ValueName|Regex>
Selects whether or not to select a specific value. The string being matched is of the form "Protocol:ValueName", where Protocol will be used as the plugin instance and ValueName will be used as type instance. An example of the string being used would be Tcp:RetransSegs.
Use regular expressions to match a large number of values with just one configuration option. To select all "extended" TCP values, use the following parameters:
Value "/^TcpExt:/"
Whether only matched values are selected or all matched values are ignored depends on the IgnoreSelected. By default, only matched values are selected. If no value is configured at all, all values will be selected. See /"IGNORELISTS" for details.
IgnoreSelected <Boolean>
If set to true, inverts the selection made by Value, I. e. all matching values will be ignored.
Example 1: ICMP Reachable
Collect statistics about the number of ICMP Destination Unreachable messages received
<Plugin protocols>
  Value "Icmp:InDestUnreachs"
  IgnoreSelected false
</Plugin>
Example 2: UDP in and out
Collect statistics about UDP in and out activity.
<Plugin protocols>
  Value "Udp:InDatagrams"
  Value "Udp:OutDatagrams"
  IgnoreSelected false
</Plugin>
Tail
Tail plugin follows files, similar to tail command, being able to parse each line and check matches using regular expressions. The matches can be used to increment counters.
Arguments
Regex <Regex>
Sets the regular expression to use for matching against a line.
ExcludeRegex <Regex>
Sets an optional regular expression to use for excluding lines from the match.
Type <Type>
Sets the type used to dispatch this value.
Instance <String>
This optional setting sets the type instance to use.
Example: Tail – Failed login
Count failed attempts to login via ssh or console
<Plugin tail>
  <File "/var/log/auth-fail">
    Instance "auth"
    <Match>
      Regex ".*.Event.ID.*[0-9]\..Failed:.*@[0-9\.]{7,15}\."
      DSType "DeriveInc"
      Type "derive"
      Instance "failed_login_ssh"
    </Match>
    <Match>
      Regex ".*.Event.ID.*[0-9]\..Failed:.*.on.'ttyS[0-9]'\."
      DSType "DeriveInc"
      Type "derive"
      Instance "failed_login_console"
    </Match>
  </File>
</Plugin>
Tcpconns
The tcpconns plugin counts the number of currently established TCP connections based on the local port and/or the remote port. It collects information from the files:
/proc/net/snmp
/proc/net/netstat
Arguments
ListeningPorts <Boolean>
If this option is set to true, statistics for all local ports for which a listening socket exists are collected. The default depends on LocalPort and RemotePort (see below): If no port at all is specifically selected, the default is to collect listening ports. If specific ports (no matter if local or remote ports) are selected, this option defaults to false, i. e. only the selected ports will be collected unless this option is set to true specifically.
LocalPort <Integer>
Count the connections to a specific local port to see how many connections are handled by a specific daemon (i.e., mailserver). Port must be numeric characters. For the mailserver example, use 25.
RemotePort <Boolean>
Count the connections to a specific remote port to determine how much a remote service is used (i.e., how many connections a mail server or news server has to other mail or news servers, or how many connections a web proxy holds to web servers). Port must be numeric characters only.
AllPortsSummary <Boolean>
(optional) If true, a summary of statistics from all connections are collected (default: false).
Example
Collect information from all ports that are listening
<Plugin tcpconns>
  ListeningPorts true
</Plugin>
Thermal
The thermal plugin reads the ACPI thermal zone.
Arguments
ForceUseProcfs <Boolean>
The Thermal plugin tries to read statistics from the Linux sysfs interface. If not available, the plugin falls back to the procfs interface. If true, the plugin is forced to use the procfs (default: false).
Device <String>
Selects name of the thermal device to collect or ignore (value of the IgnoreSelected option). Can be used multiple times to specify a list of devices.
IgnoreSelected <Boolean>
Invert the selection: If true, all devices except those that match the specified device names (Device option) are collected. By default, only selected devices are collected if a selection is made. If no selection is configured, all devices are selected.
Example: CPU Temperature
Display temperature from ACPI and CPU package
<Plugin thermal>
</Plugin>
Create visualization
Graph
- Chart type: Gauge
Filters
- plugin - is - thermal
Y-Axis
- Aggregation: average
- Field: value
- Custom label: Degrees Celsius
Split group
- Aggregation: Filters
- Filter 1: plugininstance:thermal_zone0
- Filter 2: plugininstance:thermal_zone1
Ranges:
- 0 → 40
- 40 → 60
- 60 → 90
- 90 → 110

Uptime
The Uptime plugin keeps track of the system uptime.
Arguments
None
Example
Display uptime in seconds
<Plugin uptime>
</Plugin>
Create visualization
Graph
- Chart type: Metric
Filters
- plugin - is - uptime
Metric
- Aggregation: Top hit
- Field: value
- Aggregate with: Concatenate
- Size: 1
- Sort on: time
- Custom label: Uptime (seconds)

Users
The Users plugin counts the number of users currently logged into the system.
Arguments
None
Example: Logged users
Display logged users
<Plugin users>
</Plugin>
Create visualization
Graph
- Chart type: Line
- Mode Normal
Filters
- plugin - is - users
Y-Axis
- Aggregation: Top Hit
- Field: value
- Aggregate with: Max
- Sort on: Time
- Custom label: Logged users
Split series
- Aggregation: Terms
- Field: serial_number.keyword
X-Axis
- Sub aggregation: Data histogram
- Field: time
- Minimum interval: Auto

Was this article helpful?