CHARTS sub-tab
- 12 Apr 2023
- 1 Minute to read
- Print
- DarkLight
- PDF
CHARTS sub-tab
- Updated on 12 Apr 2023
- 1 Minute to read
- Print
- DarkLight
- PDF
Article summary
Did you find this summary helpful?
Thank you for your feedback

Collapse/Expand Sensor Graphic View
To collapse the view (list only filter names), click COLLAPSE ALL. To restore, click EXPAND ALL. 
Click Right-arrow to expand and view graph display. 
Click Down-arrow to compress content.
Filter Sensor View
Filters to be applied to the displayed sensors.
Select Site drop-down, select a region (one or more). 
Select Device drop-down, select Hostname/Serial Number (one or more)
To filter, based on Date/Time range, click in FROM (to select beginning date/time) and TO (to select ending data/time). 
Run a Search
- Go to APPS :: ACTIVE :: NODEGRID DATA LAKE :: DASHBOARD :: CHARTS.
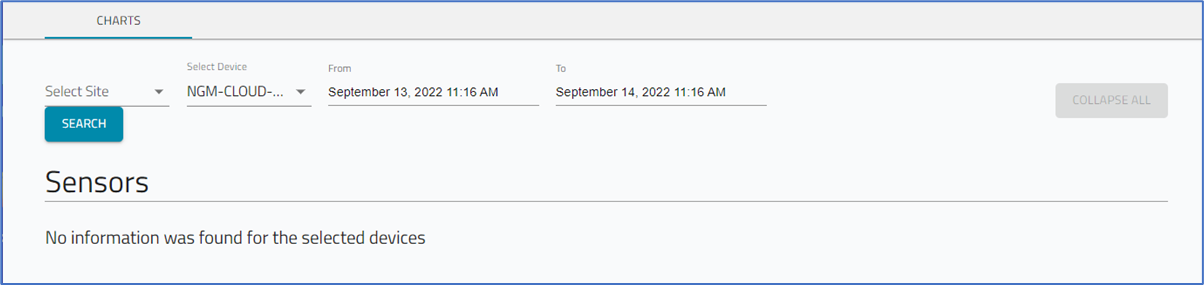
- On Select Site drop-down, select one, several, or all. (These are configured on SITES section.)
- On Select Device drop-down, select one, several, or all.
- On From drop-down, select Start Date and Time.
- On To drop-down, select End Date and Time.
- Click SEARCH.

Review the displayed results.
Was this article helpful?