Page Details
- 12 Apr 2023
- 1 Minute to read
- Print
- DarkLight
- PDF
Page Details
- Updated on 12 Apr 2023
- 1 Minute to read
- Print
- DarkLight
- PDF
Article summary
Did you find this summary helpful?
Thank you for your feedback
On the right bar, click the Help icon (displays available Help resources).
Dashboard bar

- Hamburger icon (left side) display side panel
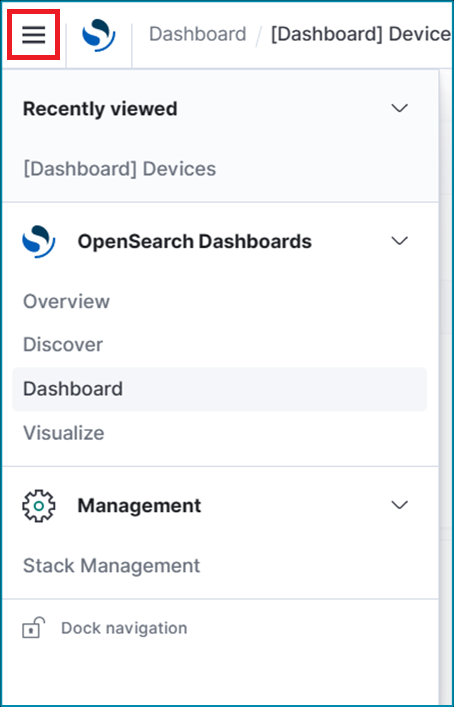
- Full Screen (expands display to full monitor width)
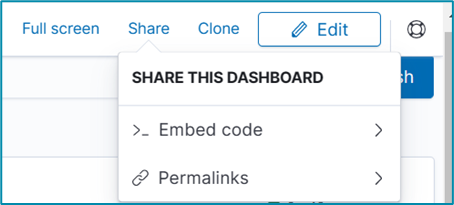
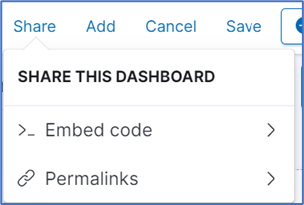
- Share (displays dialog)
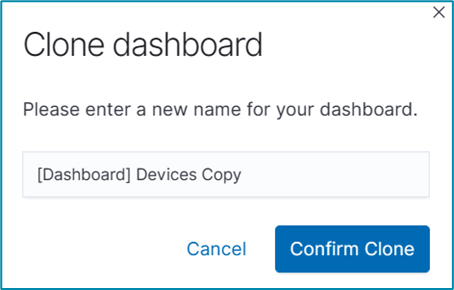
- Clone (displays dialog) - enter Name for the cloned dashboard, click Confirm Clone.


Edit Panel
To open and edit the dashboard, click Edit (right side). Provides additional links. 
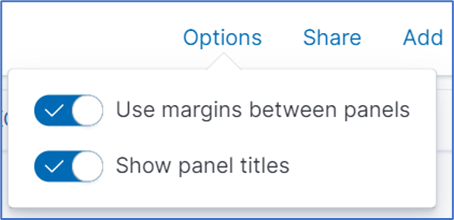
- Options drop-down. Adjust Use margins between panels toggle and Show panel titles toggle, as needed.
- Share (displays dialog).
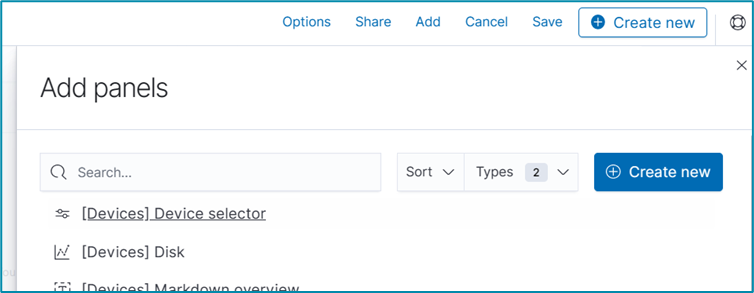
- Add (displays Add Panels dialog).
- Cancel (closes Edit dialogs).
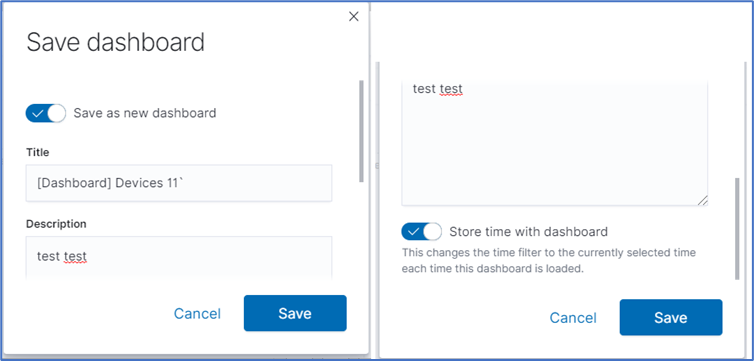
- Save (saves the changes). There is an optional Save as a new dashboard checkbox. IF selected, enter Title and Description, adjust toggle (as needed), then click Save.


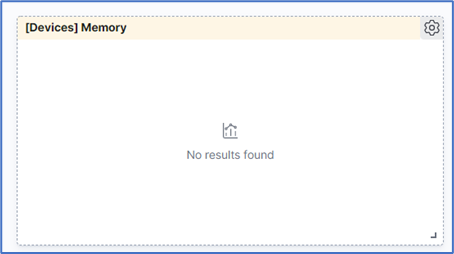
Manage Panels on Dashboard
- Move panel – click on panel title. Drag and drop panel in new location.
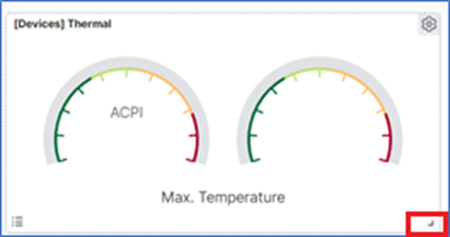
- Resize panel – at lower right corner, click on corner symbol. Drag and drop to resize.
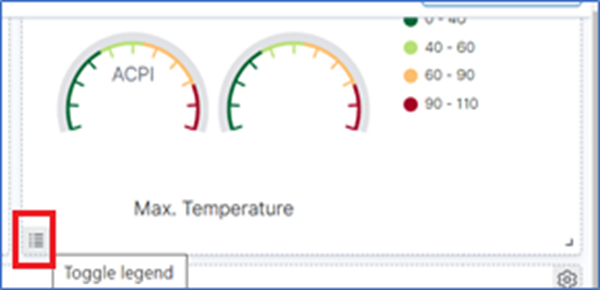
- Toggle panel legend – at lower left corner, click to enable/disable.


Search panel

- Enter a Search condition, click Update.
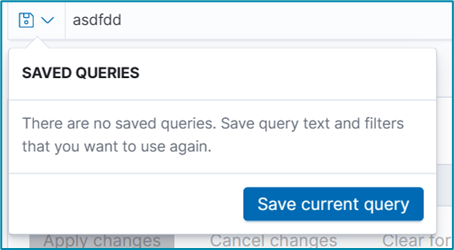
- (optional) click Save Query icon (displays dialog). Click Save current query.
- On Save Query dialog:
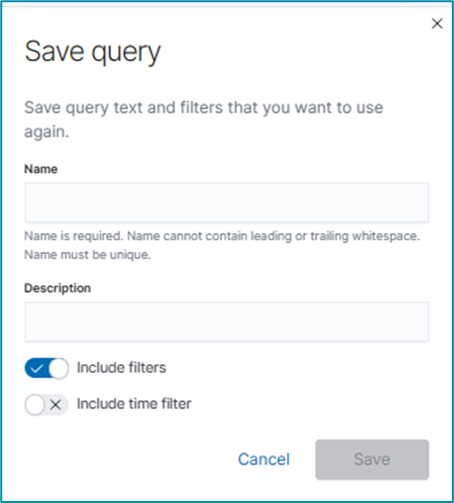
- Enter Name.
- Enter Description.
- (optional) Include Filters toggle.
- (optional) Include time filter toggle.
- Click Save.


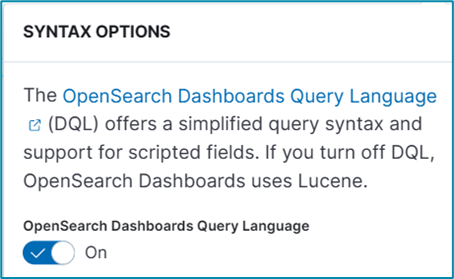
Use Data Query Language
To use Data Query Language:
- Click DQL link (displays dialog). Enable/disable toggle, as needed.
- Time range panel (click Refresh, as needed).

- To select time range, click Calendar icon (displays dialog).
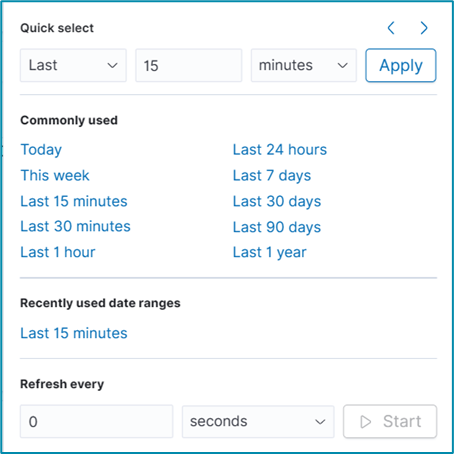
- Click options in Commonly used or Recently used data ranges menus.


Alternatively, in Quick Select:
- Time direction drop-down, select one (Last, Future).
- Enter a number.
- Time download, select one (seconds, minutes, hours, days, weeks, months).
- Click Apply.
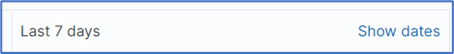
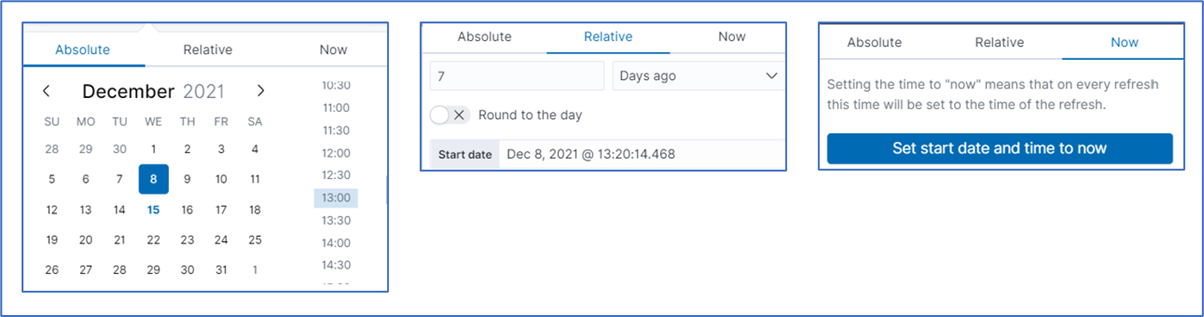
Show Dates
- Click Show dates (modifies details according to the time range selected).
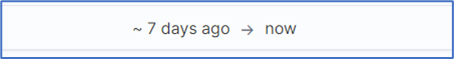
- Click within the date/time (displays dialog of three tabs). Make changes, as needed.


Filters Panel
On Filters panel: 
- Click Manage Filter icon (displays dialog).
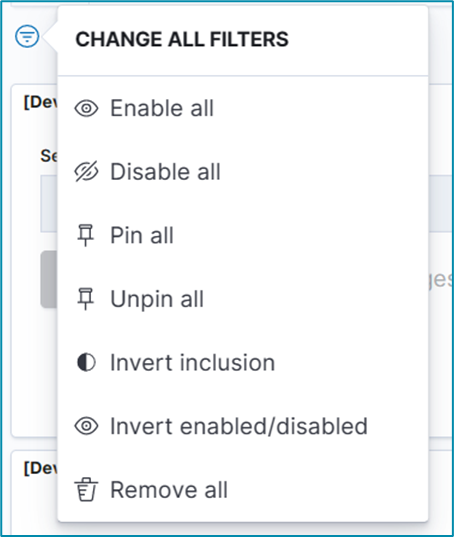
- Select items for control filters, as needed.

Add Filter
- To include a new filter, click + Add Filters (displays dialog).
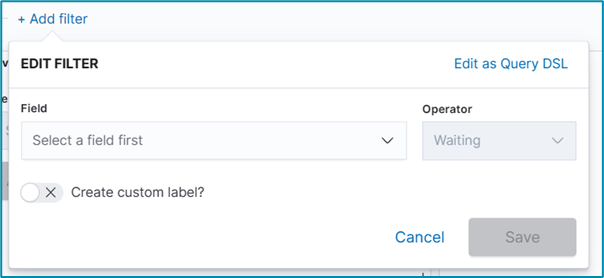
- Field drop-down, select one.
- Operator drop-down, select a Boolean expression.
- Based on Field selection, Values drop-down changes. Select one.
- (optional) Create custom label toggle. If enabled, enter Customer label.
- Click Save. (Filter names are displayed on the Filter panel.)

Edit Query DSL
- Click Edit as Query DSL (displays dialog).
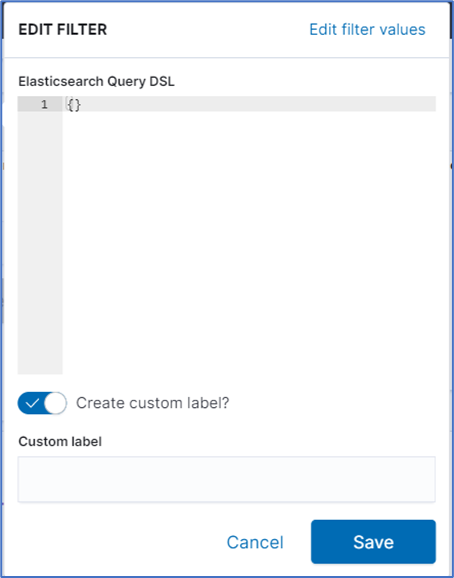
- Enter code block.
- (optional) Create custom label toggle. If enabled, enter Customer label.
- Click Save.

Click on the filter name to display options. 
How to view Device Events in Data Lake
- Go to APPS :: ACTIVE :: NODEGRID DATA LAKE :: EXPLORER.
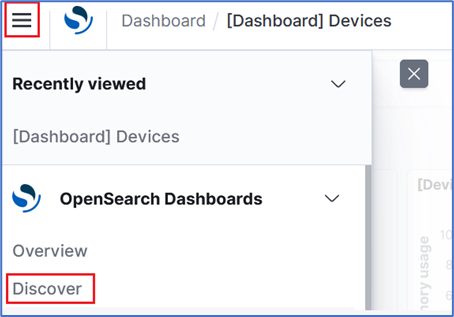
- Click on Hamburger icon, and on drop-down, click Discover.
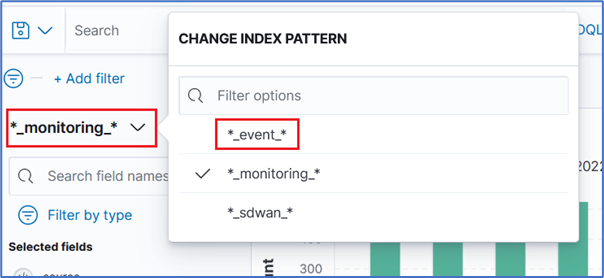
- Click on *_monitoring_*. On the pop-up dialog, click on *_event_*
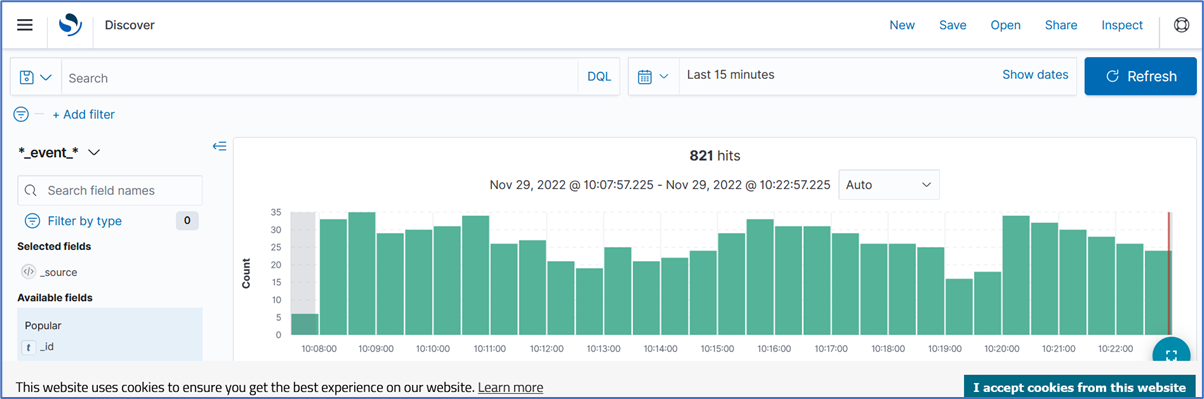
- Device events are displayed.
- Events can be filtered by job_id, host, serial_number.
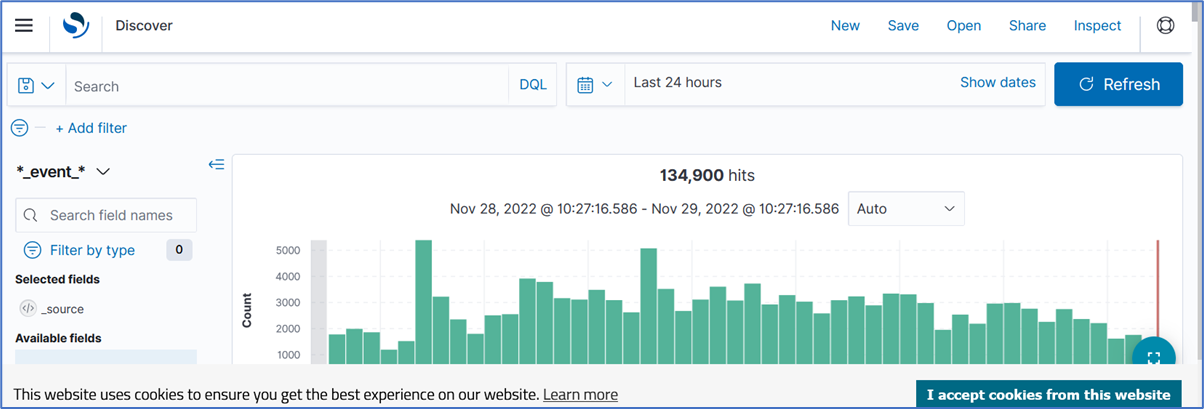
- The time line can be modified, i.e., Last 15 Minutes to Last 24 Hours.


Was this article helpful?