Dashboards are a collection of one or more visualizations. These objects can be created, modified, and deleted.
Manage Dashboards
Create Dashboard
- On the left side panel, click Dashboard tab (main panel lists saved visualizations).
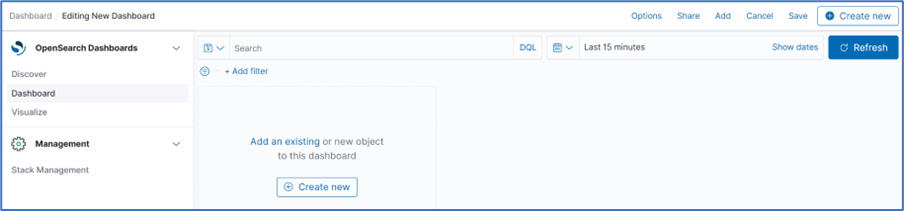
- On the Navigation bar, click the Create New icon.

- On the Editing New Dashboard panel, click Add.
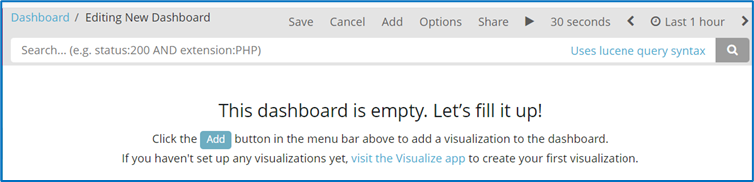
- On the Add Panels dialog, top panel lists available visualizations. To the upper right is the option to create a new visualization.
- On the visualization list, click the first one to add. The visualization displays in the dashboard panel. Click others to add those to the dashboard panel.
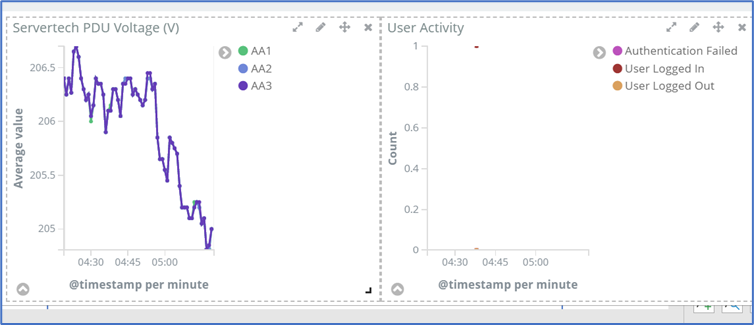
- Resize (lower right corner handle) and reposition (click, drag and drop) the graphs, as needed.
- If needed, to include a filter, click Add a filter (displays Add a Filter dialog).
Select from Filter drop-down, Enter Label, then click Save. - When the dashboard appearance and details are ready, click Save icon.
- On the Save dashboard dialog:
- Enter Title.
- Enter Description.
- Click Save.
- The new dashboard is added to the list.