About this document
HAR files are usefull to get a detailed log of how a browser interacts with a website. This is essential for debugging complex issues, analyzing performance, and providing technical support with a complete record of network activity.
There are a few key reasons of why is good to export and use HAR files, mostly related to troubleshooting and performance analysis:
- Diagnosing Performance Issues: If a webpage is slow, a HAR file can reveal which resources (images, scripts, etc.) are taking the longest to load. This helps developers pinpoint and fix performance bottlenecks.
- Debugging Errors: When a page isn't loading or functioning correctly, the HAR file shows if any critical resources are failing to load or returning errors.
- Sharing Network Information: Instead of trying to describe a complex network-related problem, a user can simply export a HAR file and send it to a developer or support team. This gives the technical team a complete and accurate picture of what's happening in the user's browser.
- Analyzing Security: HAR files can be used to inspect the security of a web application by examining headers, cookies, and other security-related information.
Generate a HAR file in Google Chrome
- Open Developer Tools:
- Right-click anywhere on the page you want to record.
- Select "Inspect" from the context menu.
- Alternatively, use the keyboard shortcut: Cmd+Option+I (on macOS) or Ctrl+Shift+I (on Windows/Linux).
- Select the Network Tab:
- In the Developer Tools panel that appears, click on the "Network" tab.
- Start Recording:
- Look for a round button in the top-left of the Network tab. If it's grey, click it to start recording network activity. It will turn red to indicate it's recording.
- Check the "Preserve log" checkbox if you need to record activity across multiple page loads.
- Reproduce the Activity:
- With the recording active, perform the exact actions on the webpage that you want to capture. For example, if you're debugging a login issue, go through the login process.
- You will see network requests appearing in the panel as you interact with the page.
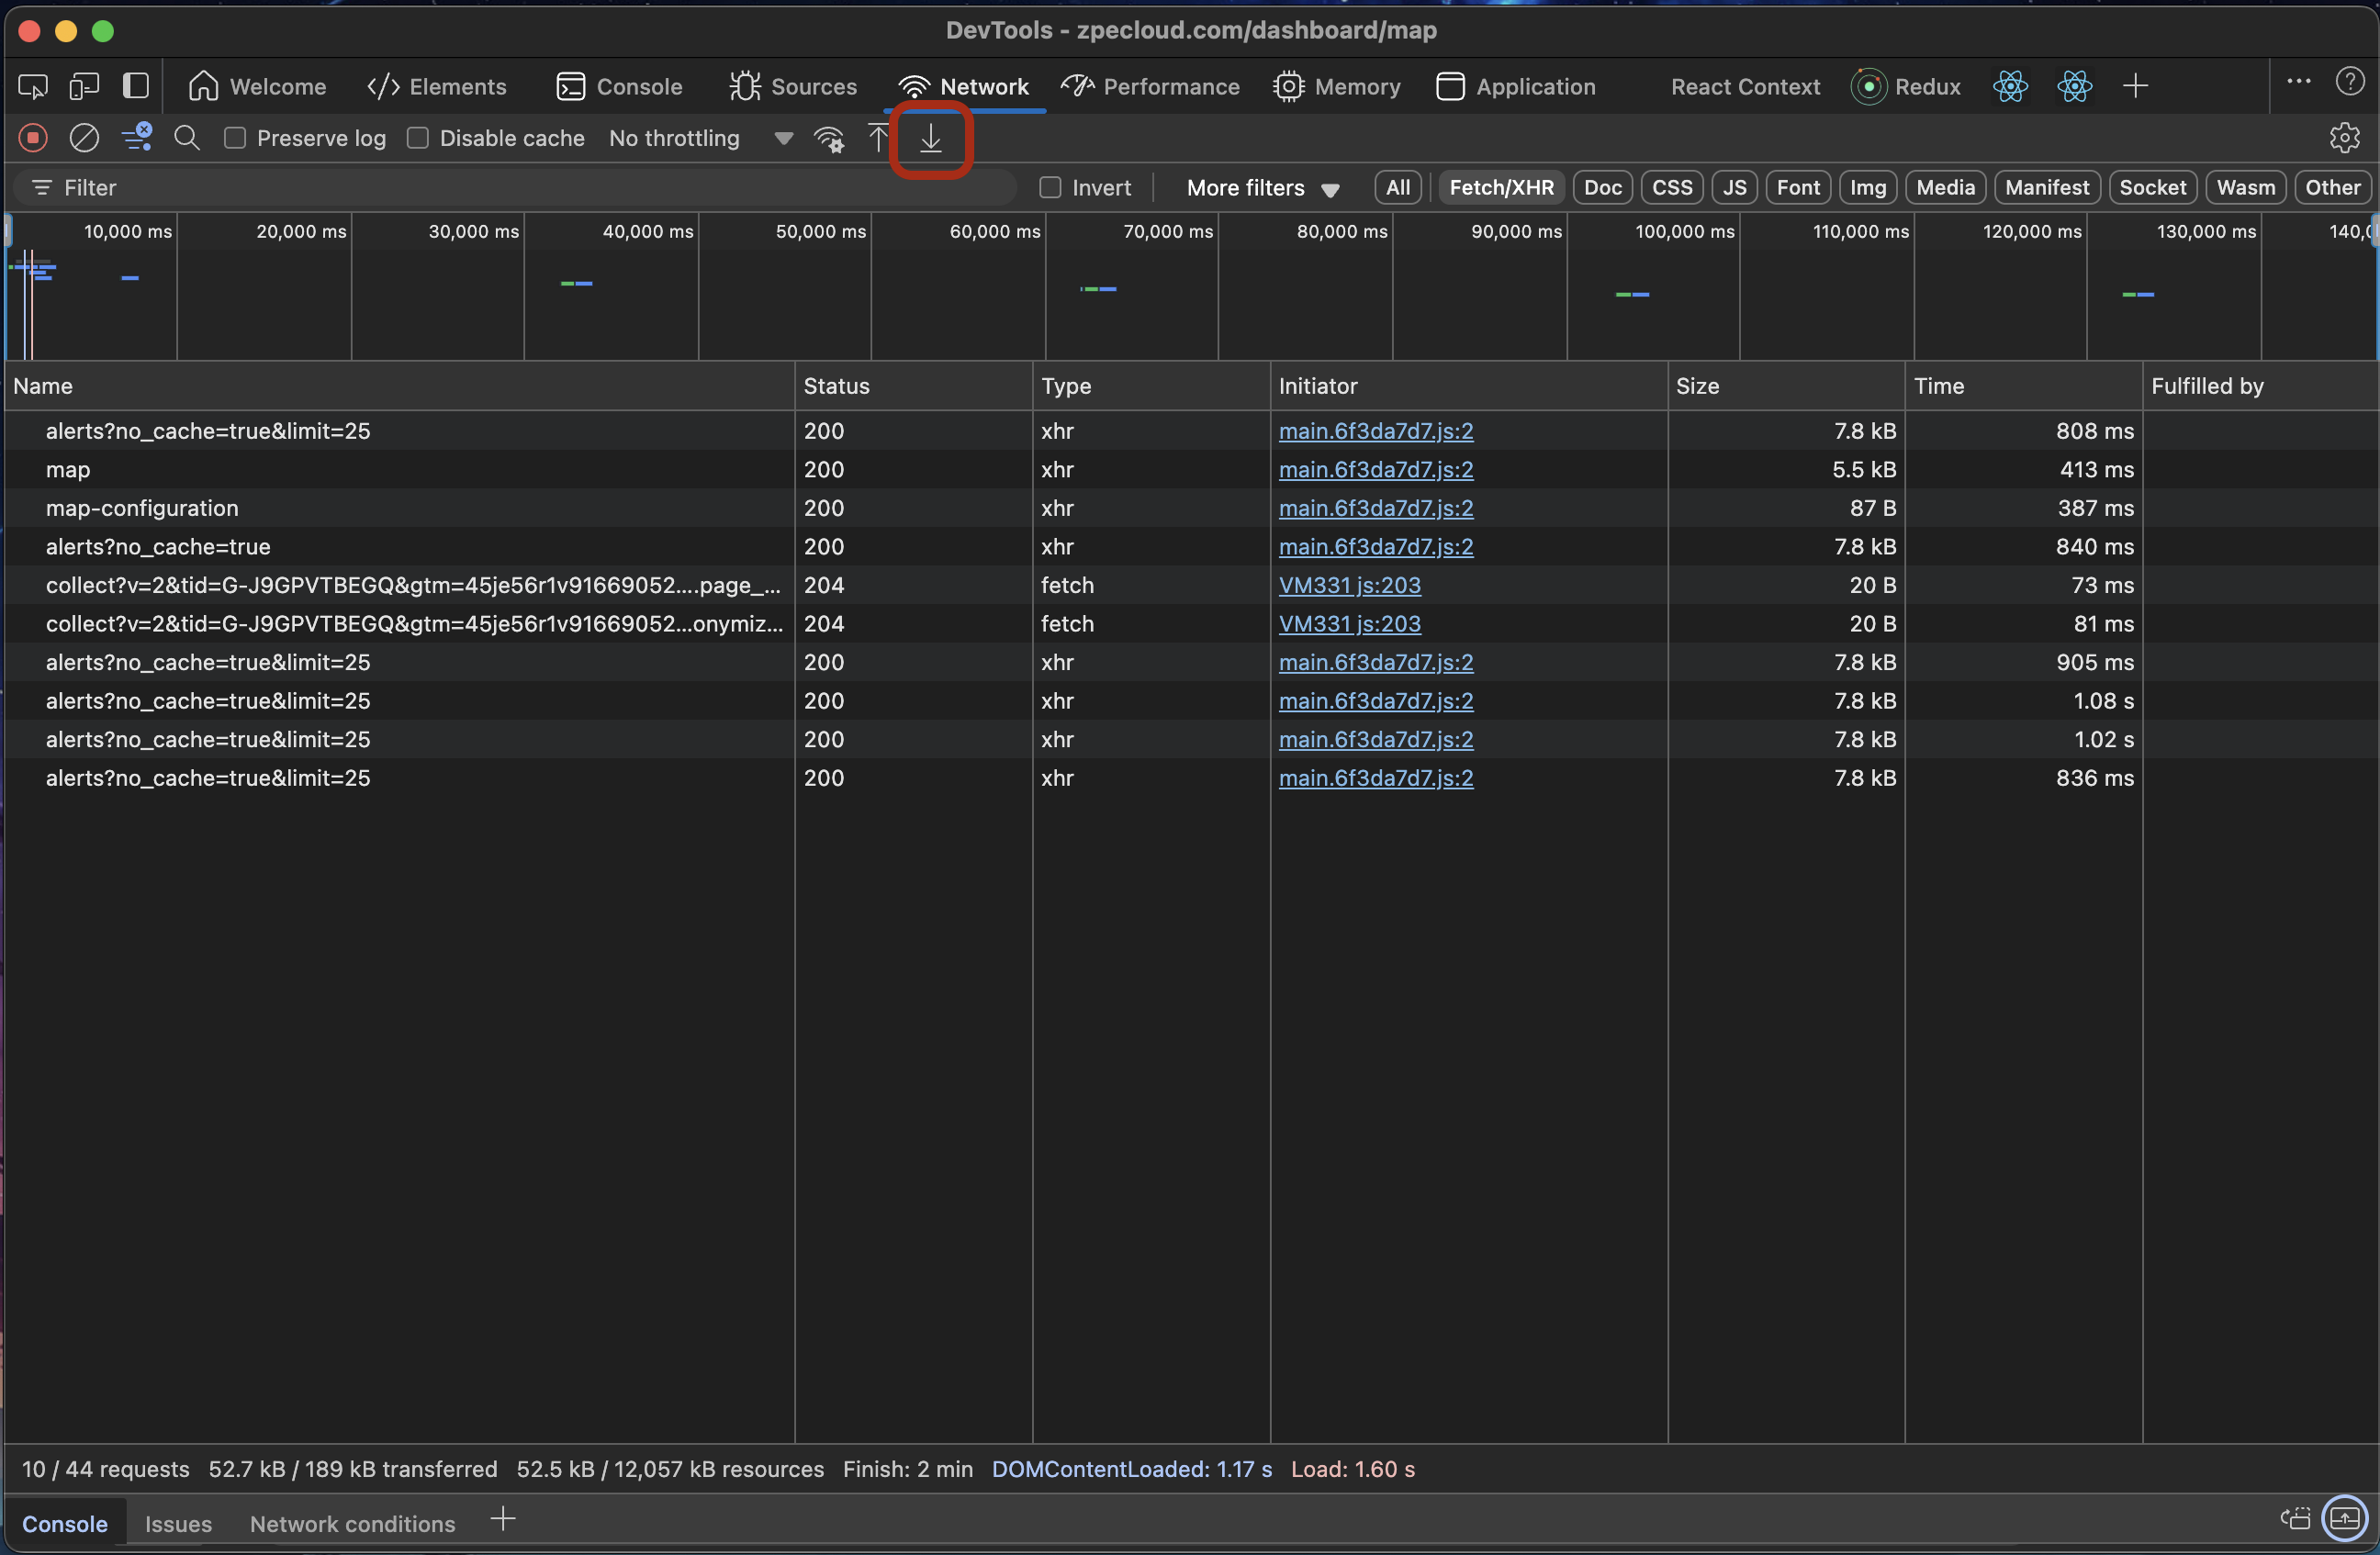
- Export the HAR File:
- Once you have reproduced the activity, click the "Export HAR..." button (it looks like a download arrow) in the Network tab's toolbar.
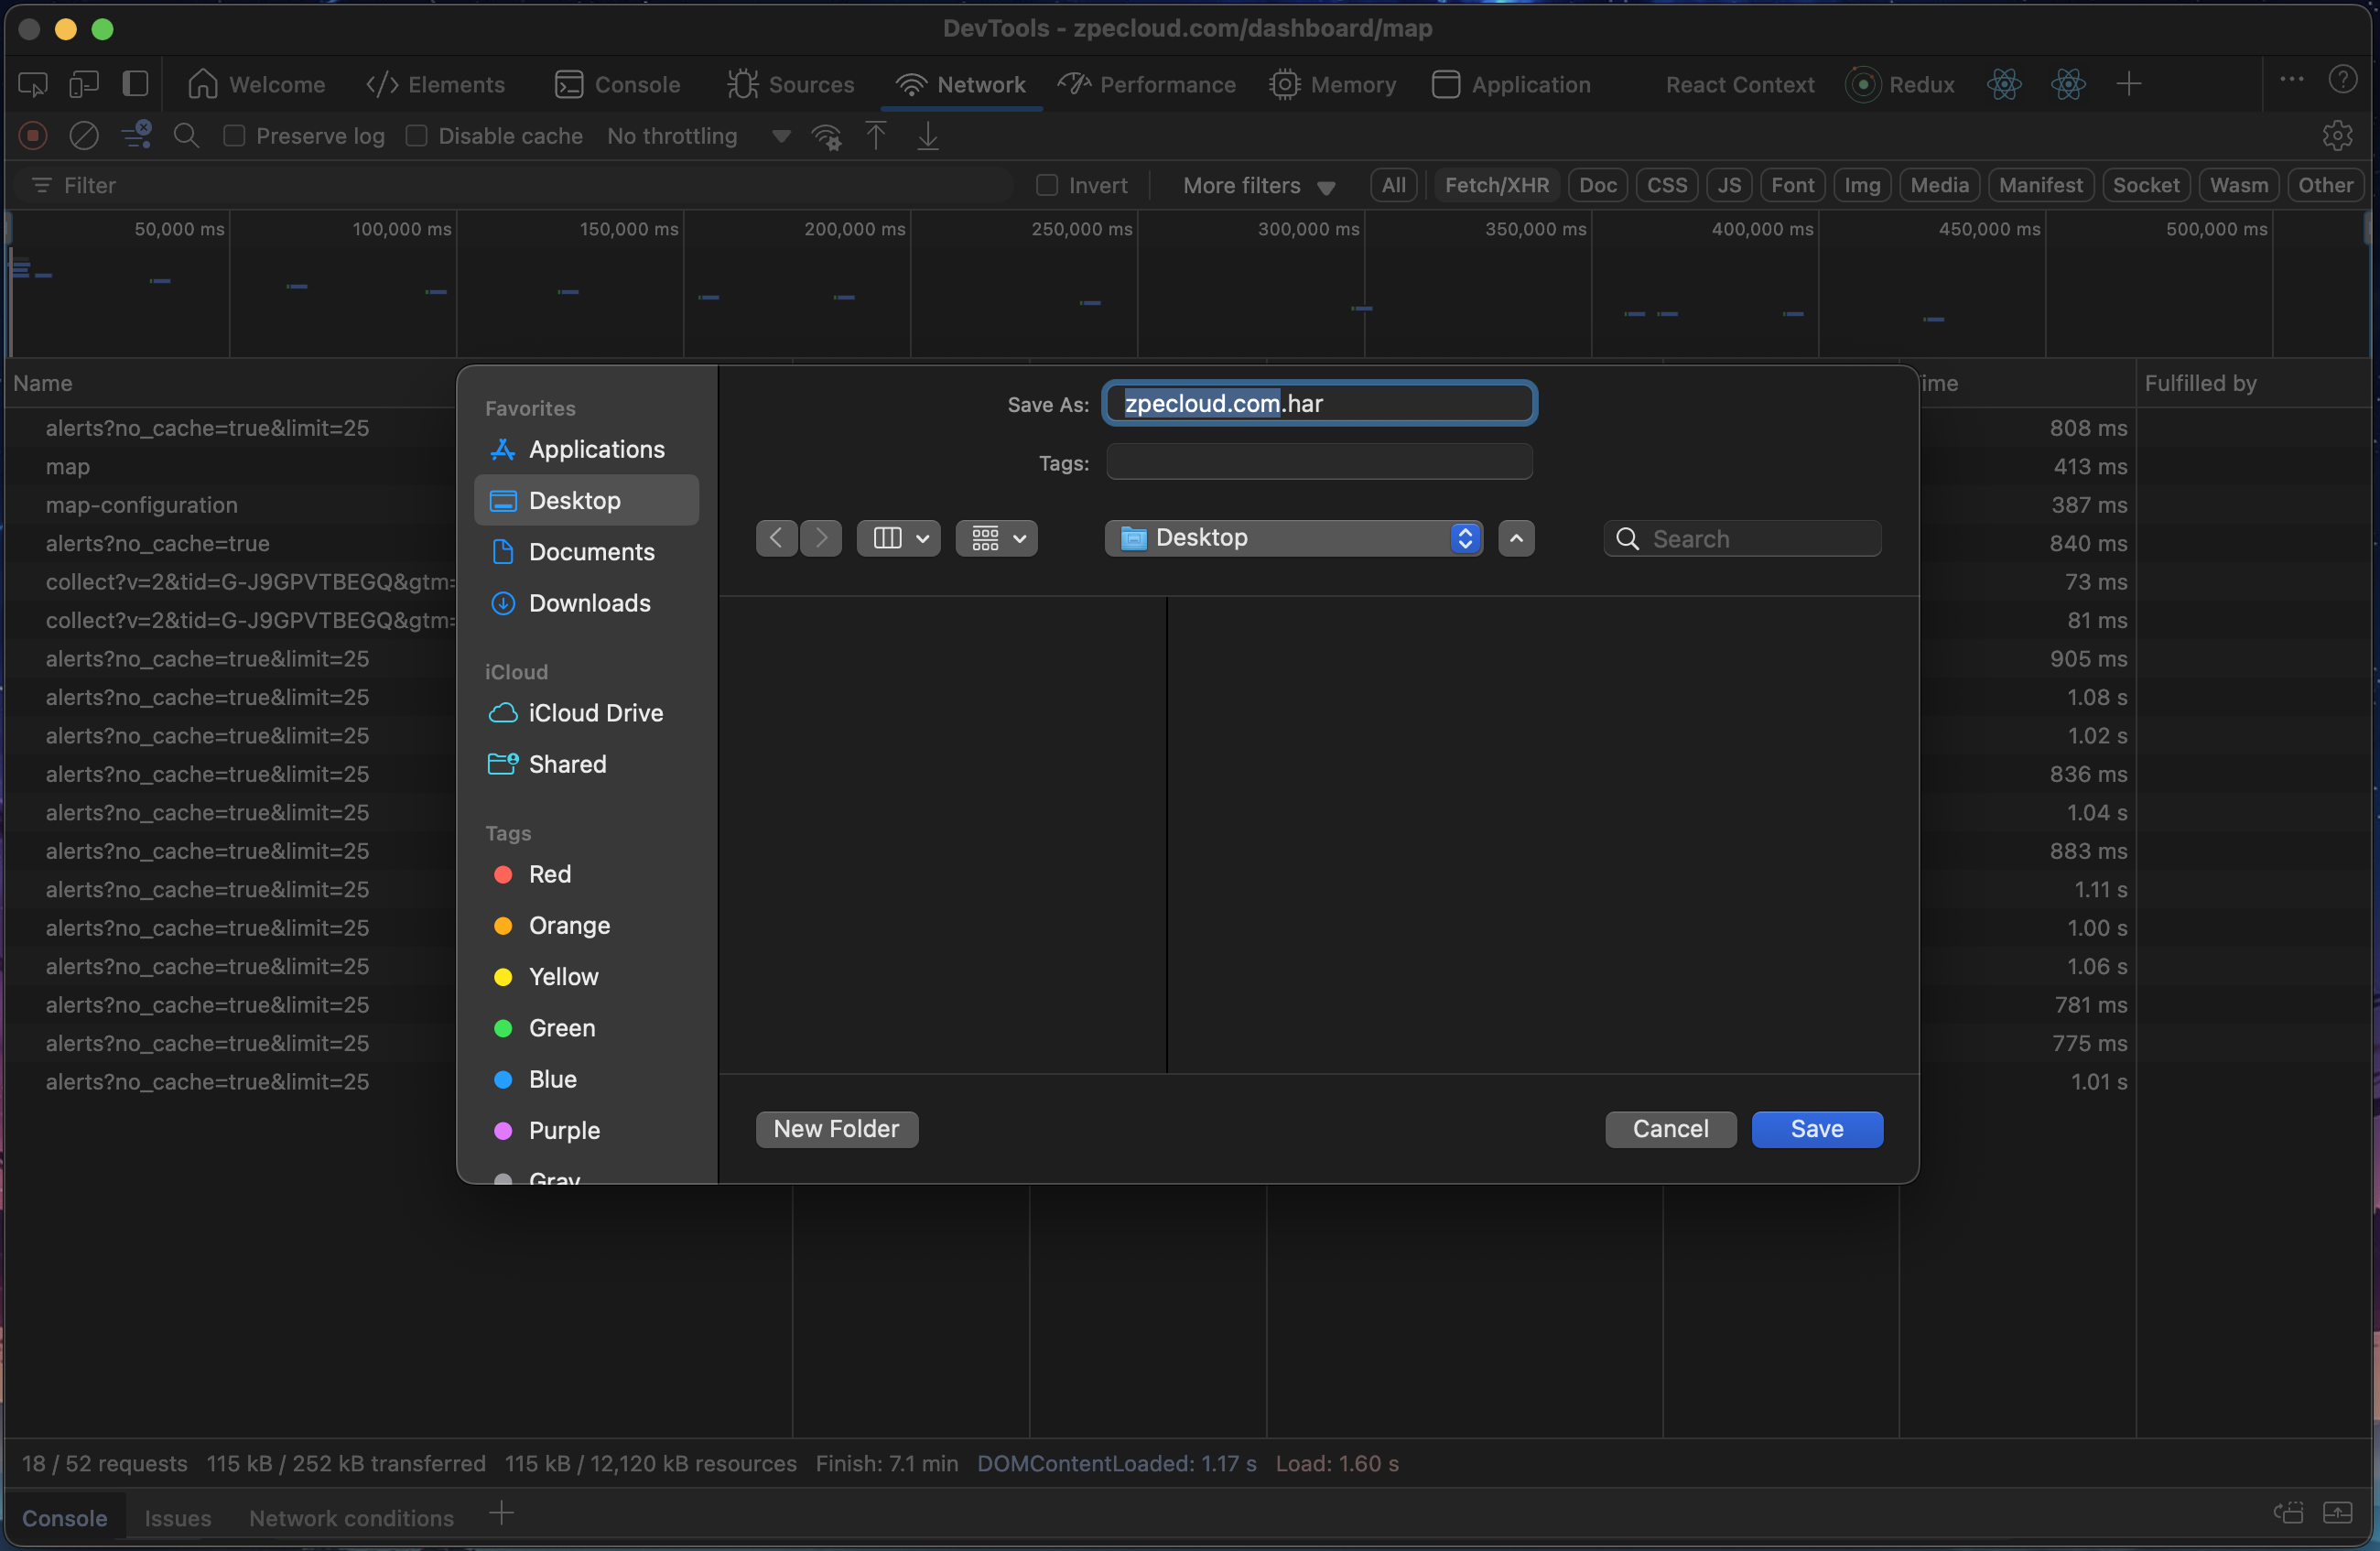
- Save the File:
- A "Save As" dialog will appear. Choose a name and location for your file and click "Save". The file will have a .har extension.
Generate a HAR file in Mozilla Firefox
- Open Developer Tools:
- Right-click on the page you want to record.
- Select "Inspect" from the context menu.
- Alternatively, use the keyboard shortcut: Cmd+Option+I (on macOS) or Ctrl+Shift+I (on Windows/Linux).
- Select the Network Tab:
- In the Developer Tools panel, click on the "Network" tab.
- Start Recording:
- The network monitor usually starts recording automatically when you open it. If it's paused, you can start it by clicking the play/pause button in the toolbar.
- Click the "Persist Logs" option (it looks like a gear icon in some versions, or may be a checkbox) in the Network tab's toolbar if you need to record activity across multiple page loads.
- Reproduce the Activity:
- With the recording active, perform the actions on the webpage that you want to capture.
- You will see network requests appearing in the panel as you interact with the page.
- Export the HAR File:
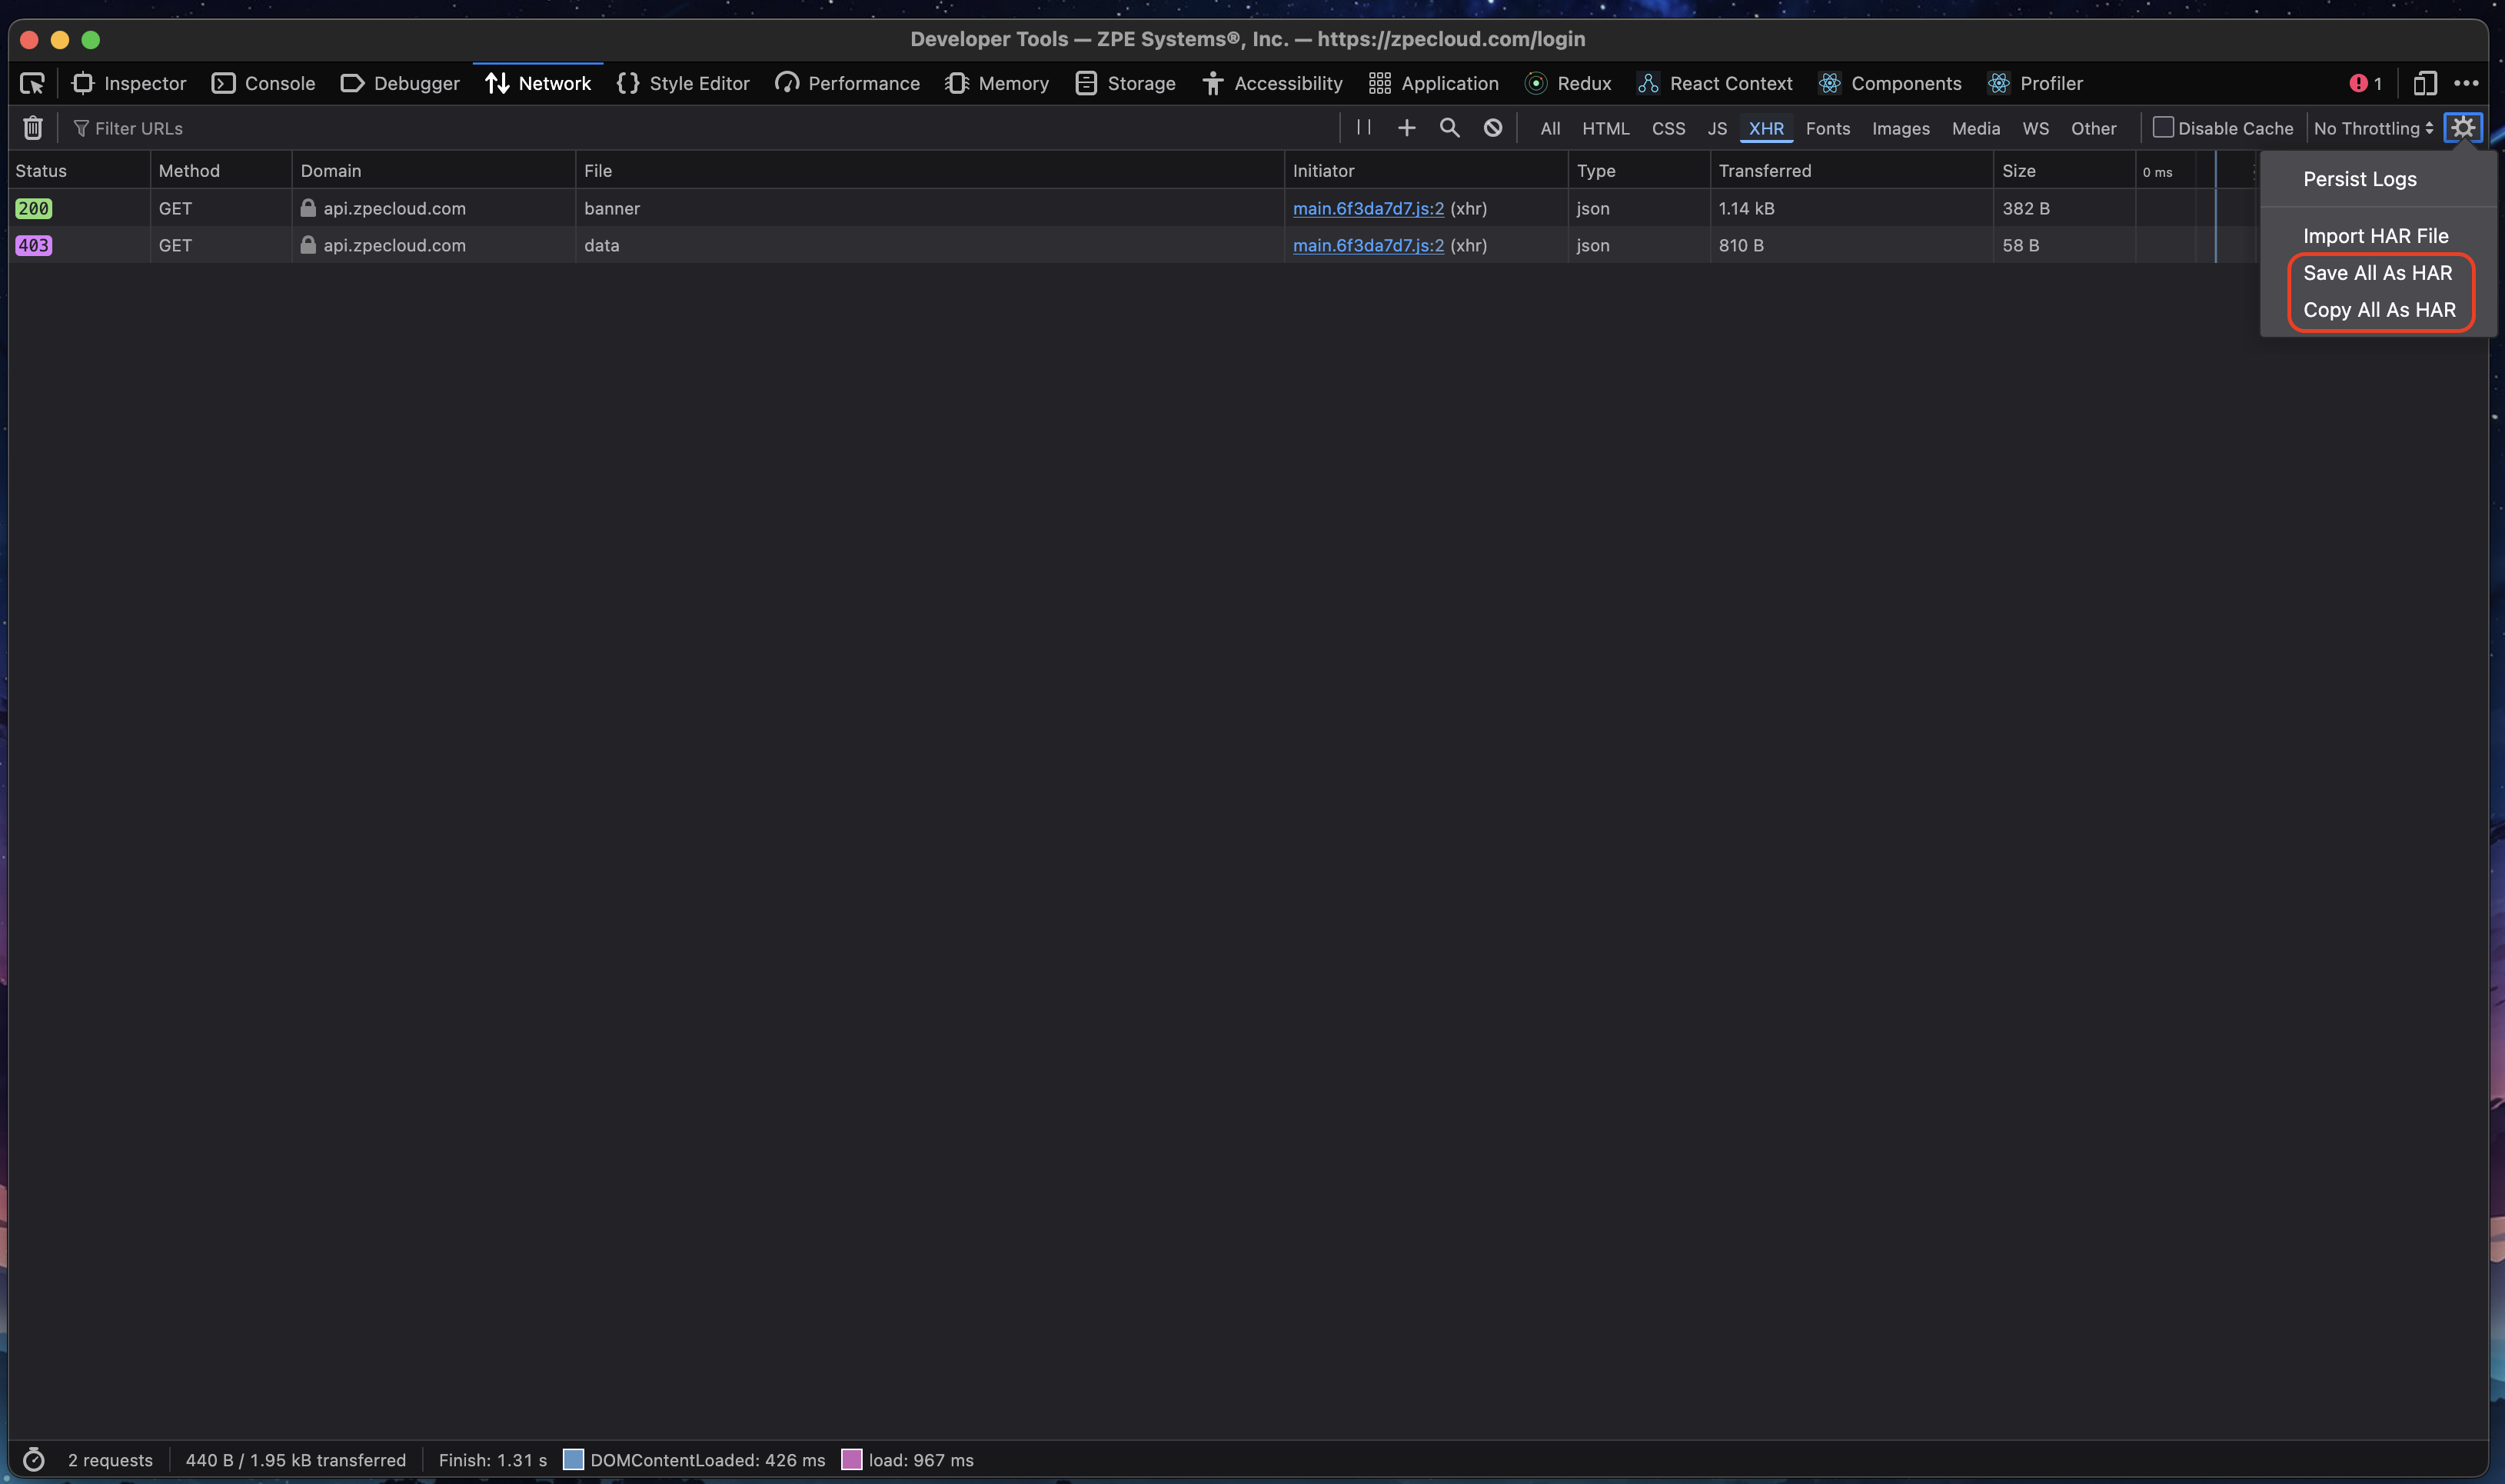
- Once you have reproduced the activity, right-click anywhere in the list of network requests.
- From the context menu, select "Save All As HAR".
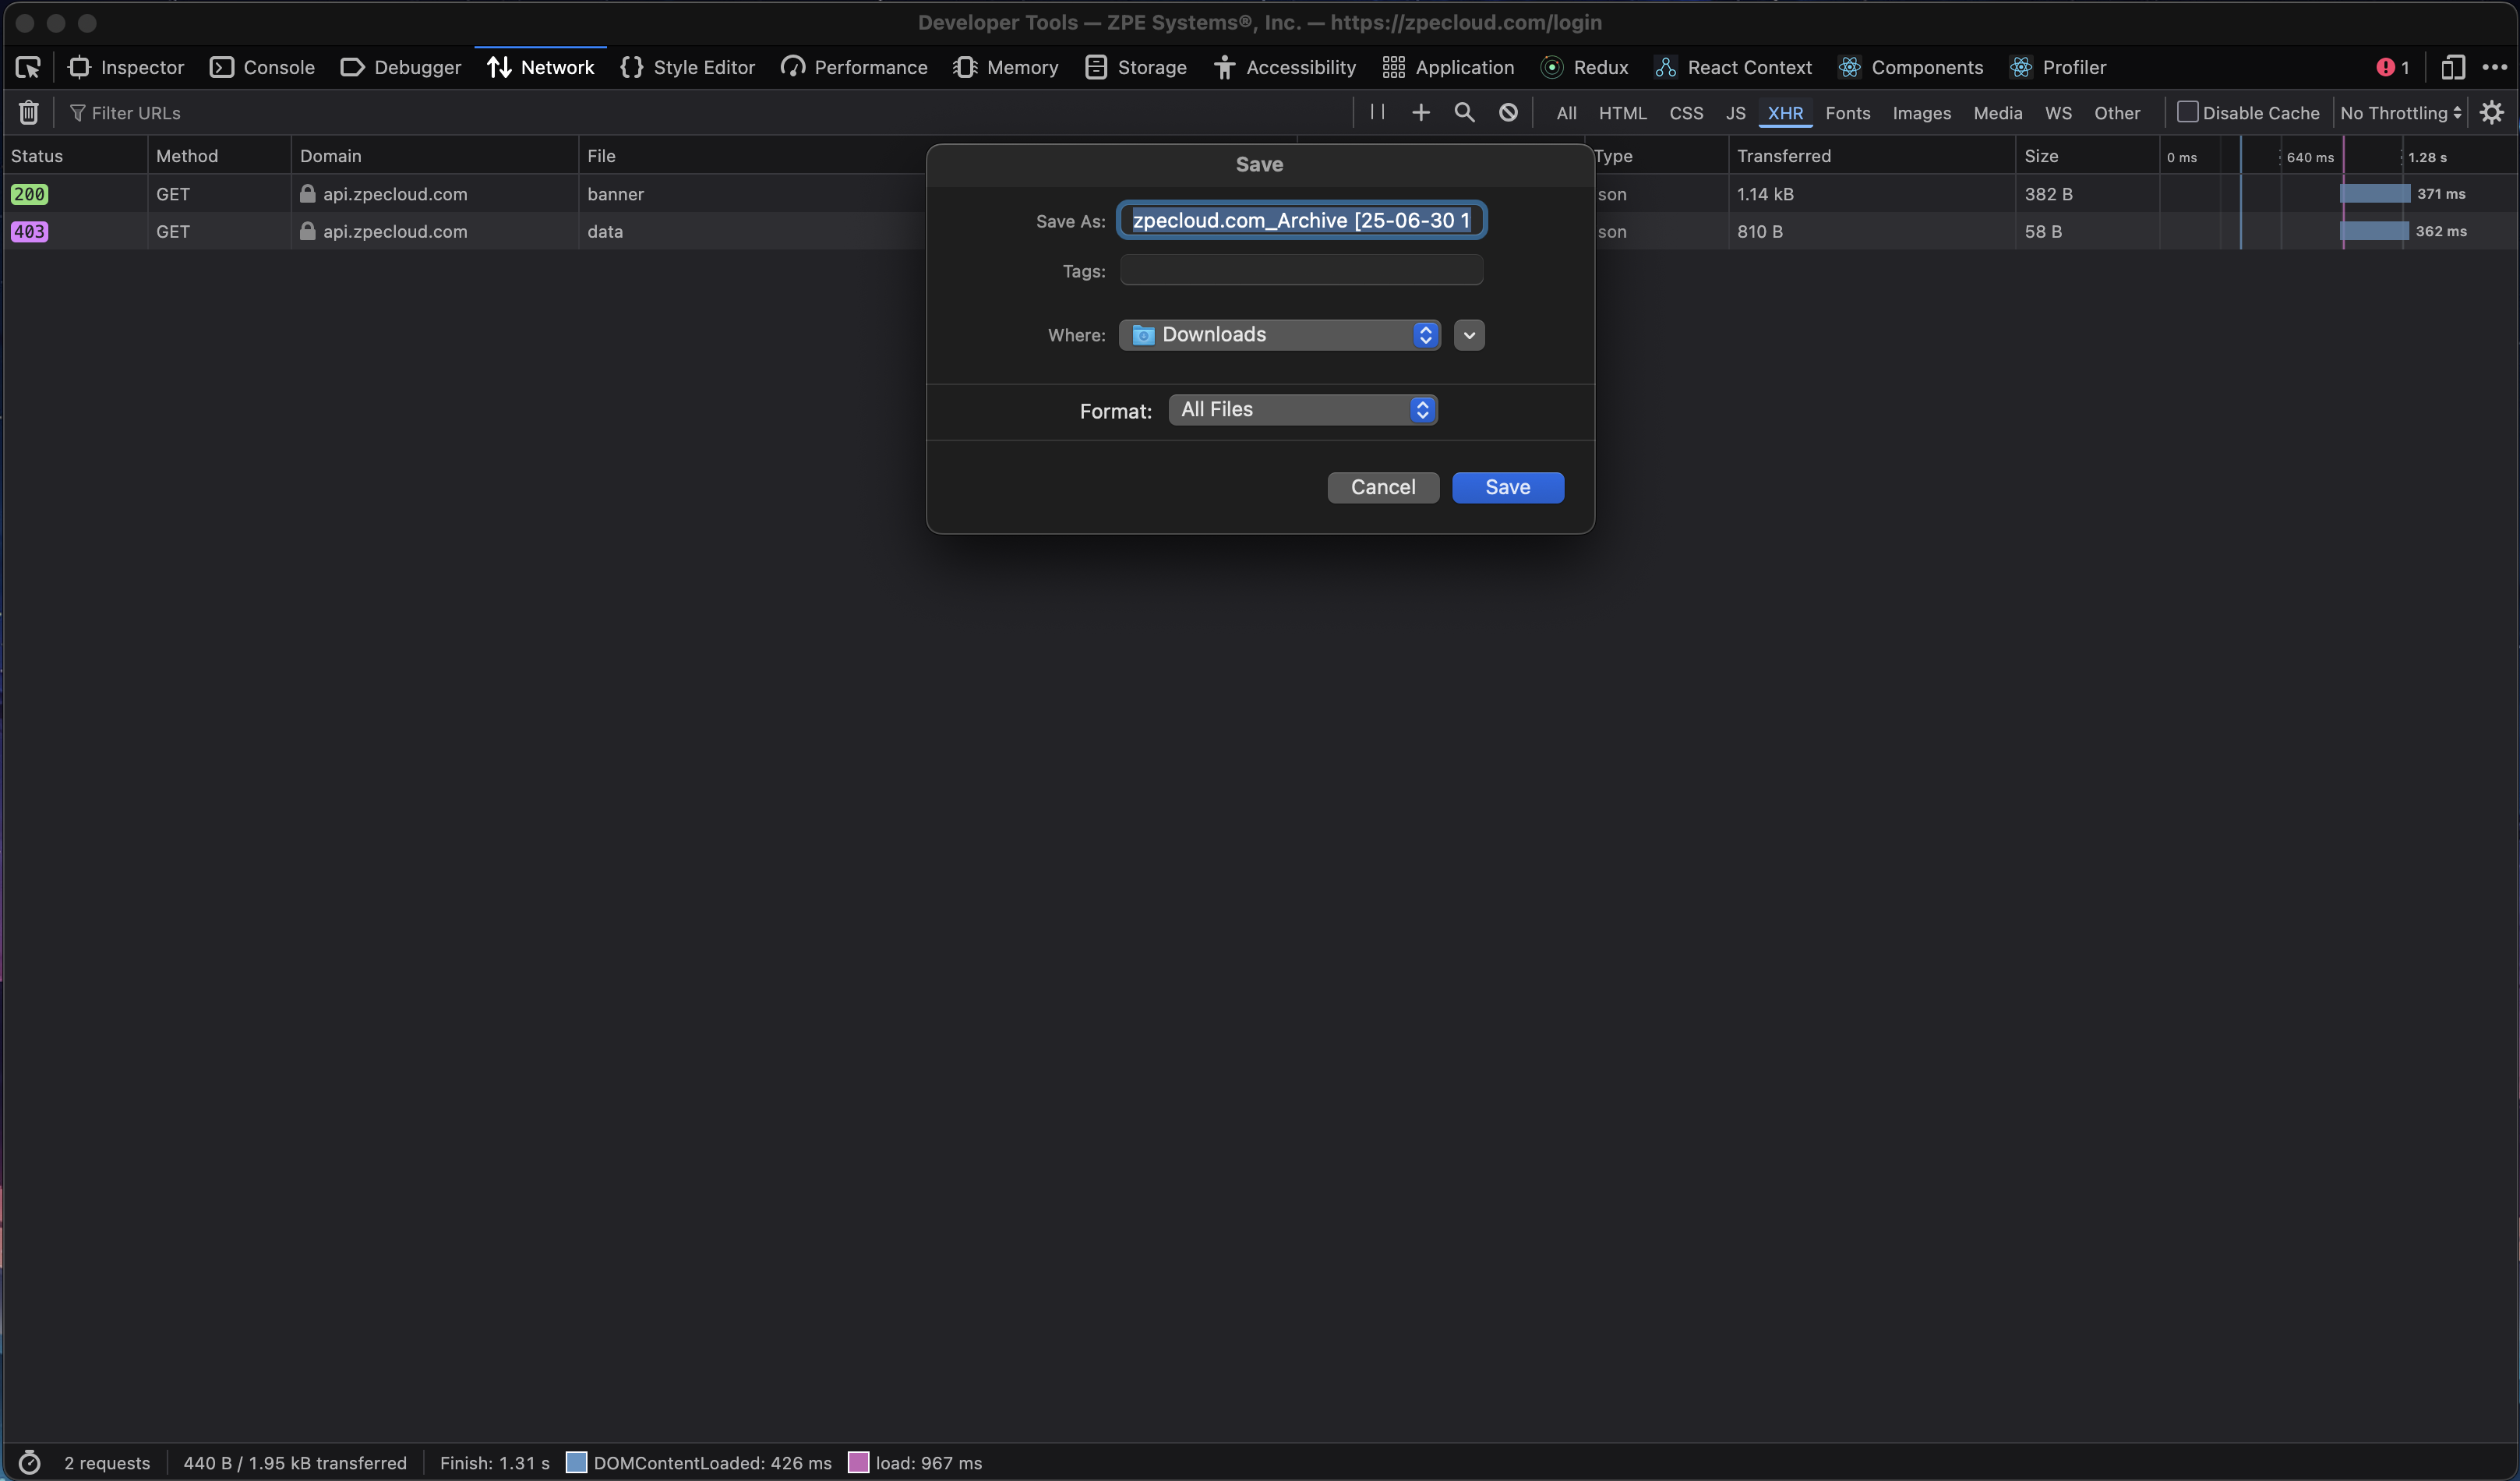
- Save the File:
- A "Save As" dialog will appear. Choose a name and location for your file and click "Save". The file will have a .har extension.
Generate a HAR file in Apple Safari
Part 1: Enable the Develop Menu (if you haven't already)
- Open Safari.
- Go to the Safari menu in the top-left corner of your screen and select Settings... (or Preferences... on older macOS versions).
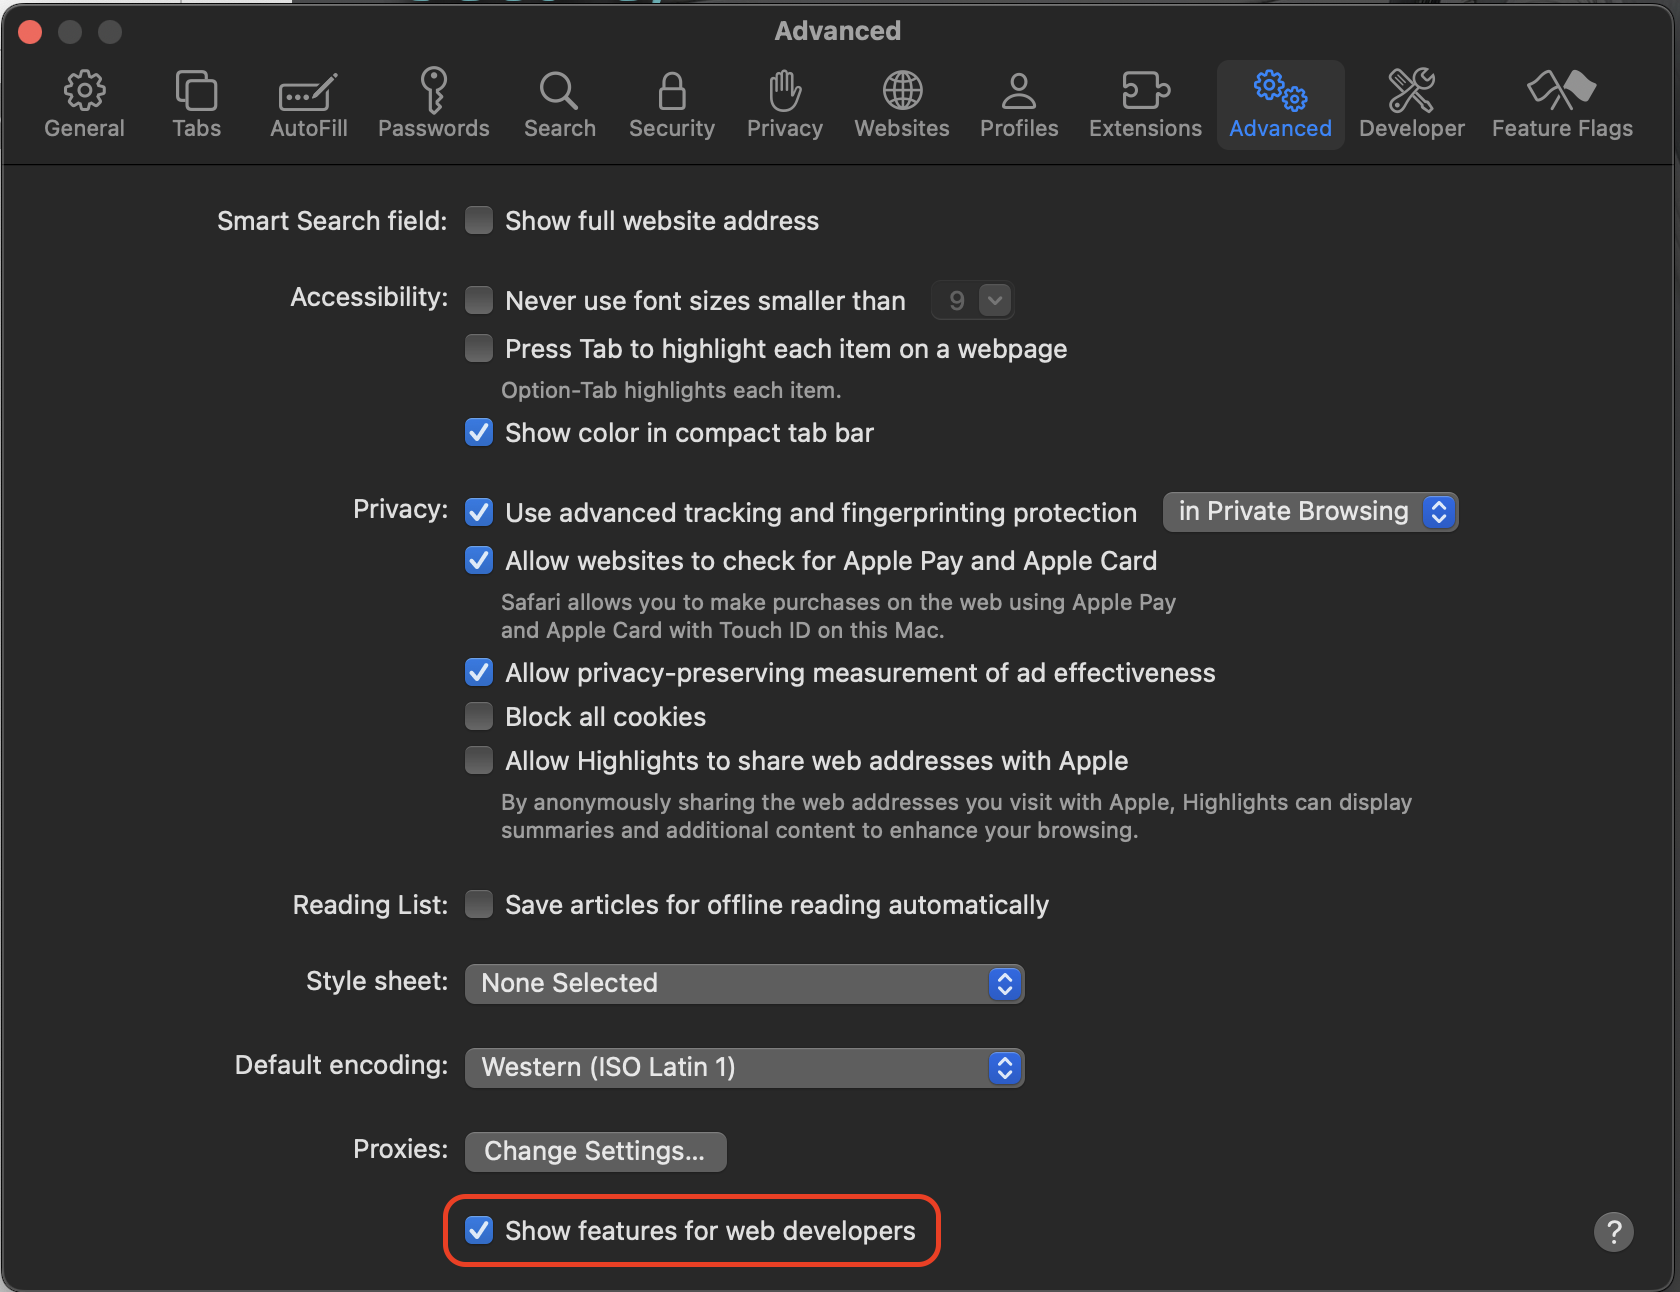
- Click on the Advanced tab.
- At the bottom of the window, check the box that says "Show Develop menu in menu bar".
- You can now close the Settings window.
Part 2: Record and Save the HAR File
- Navigate to the web page you want to record.
- Click on the new Develop menu in the menu bar and select Show Web Inspector.
- Alternatively, use the keyboard shortcut: Cmd+Option+I.
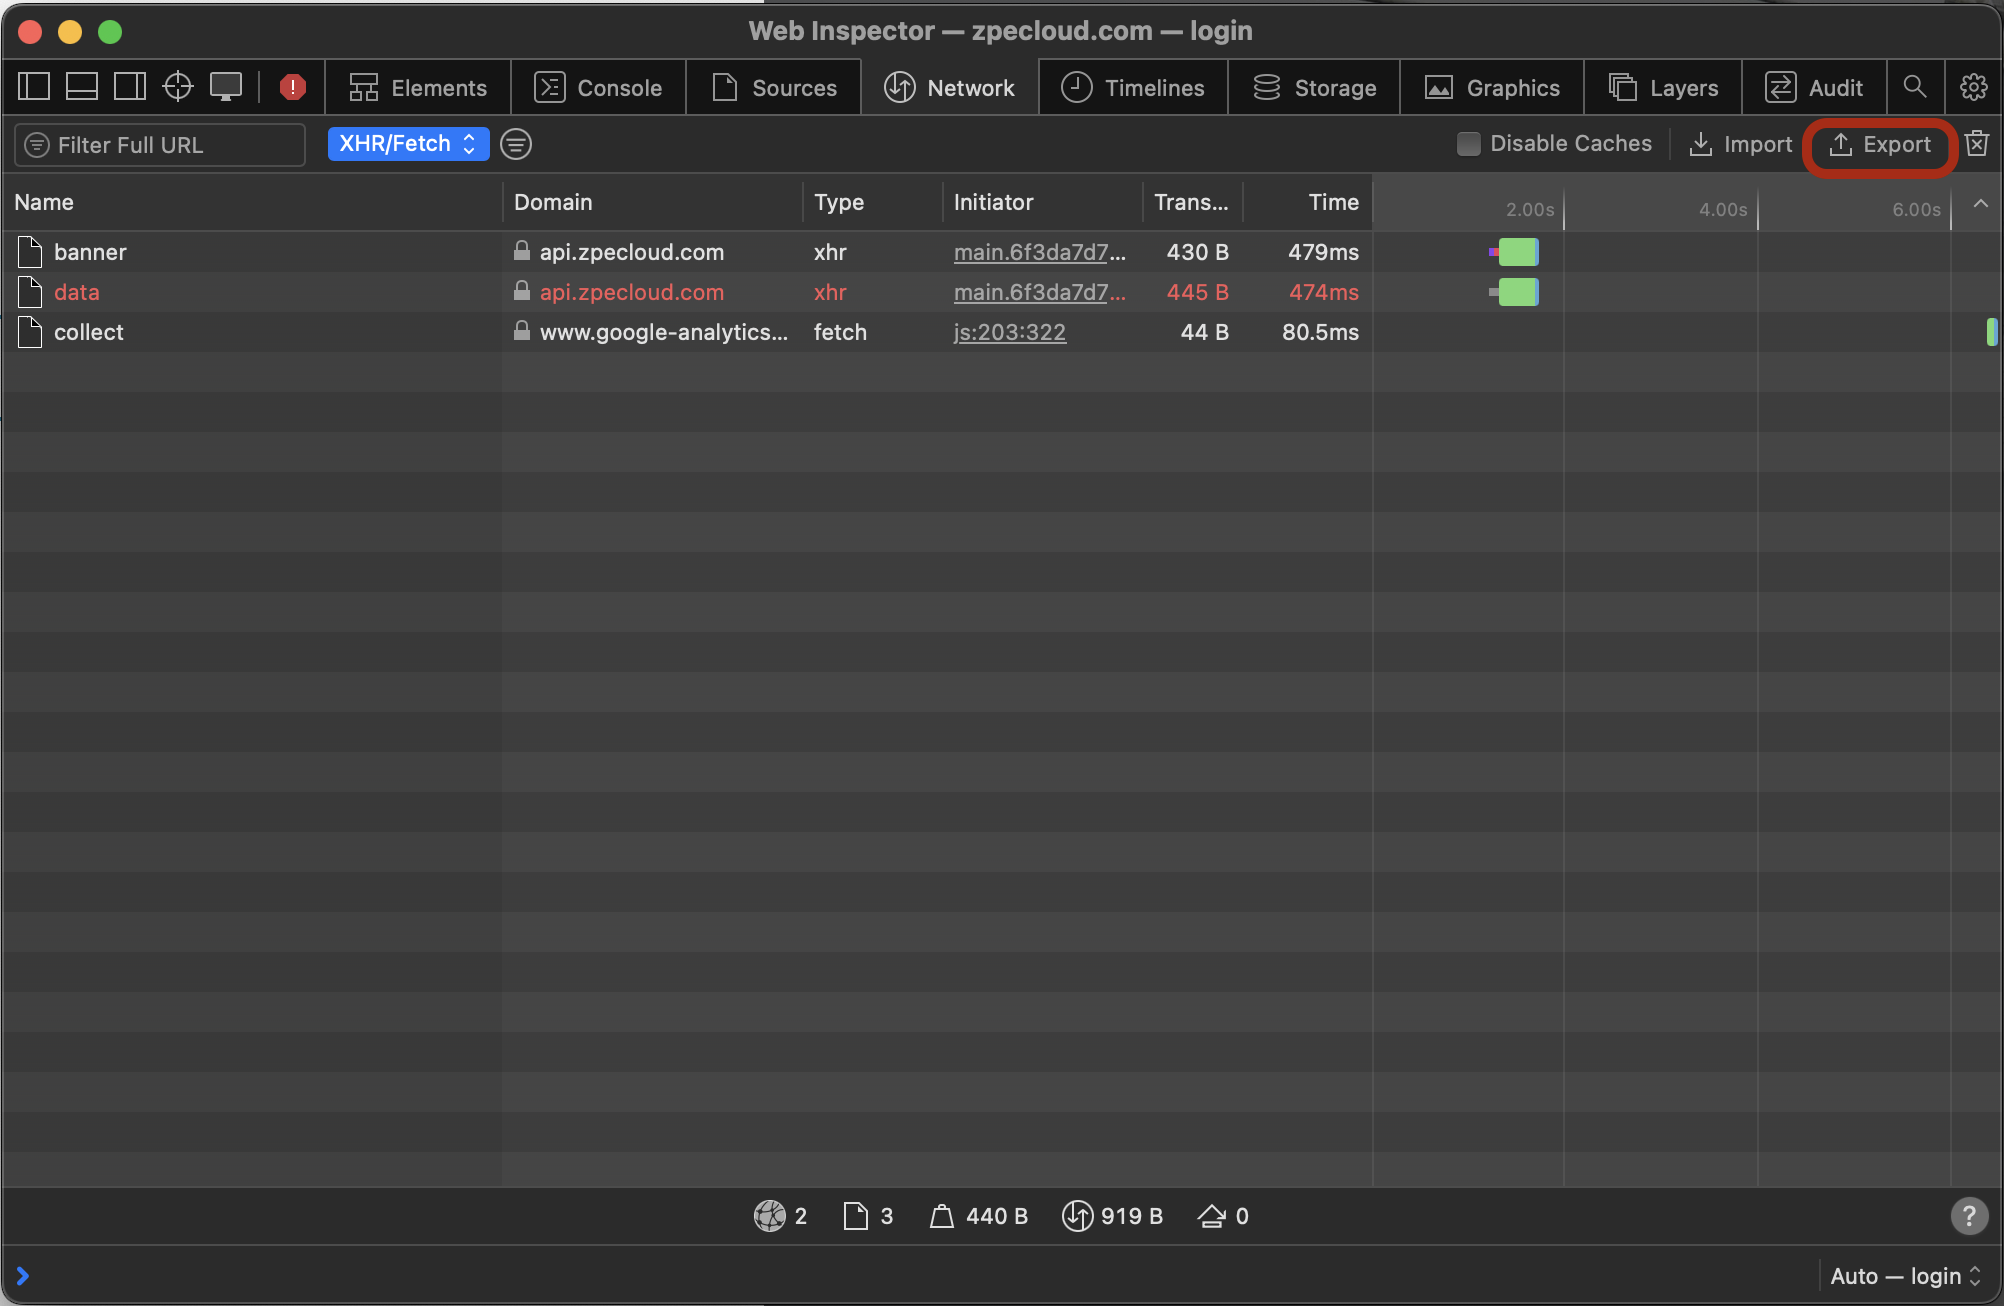
- Click on the Network tab in the Web Inspector window.
- Check the "Preserve Log" option in the Network tab's toolbar (it looks like a small trash can icon with a gear or a circle around it in different versions). This will prevent the log from clearing when you navigate
to a new page. - Perform the actions on the webpage that you want to capture in the recording. You will see network requests appear in the list.
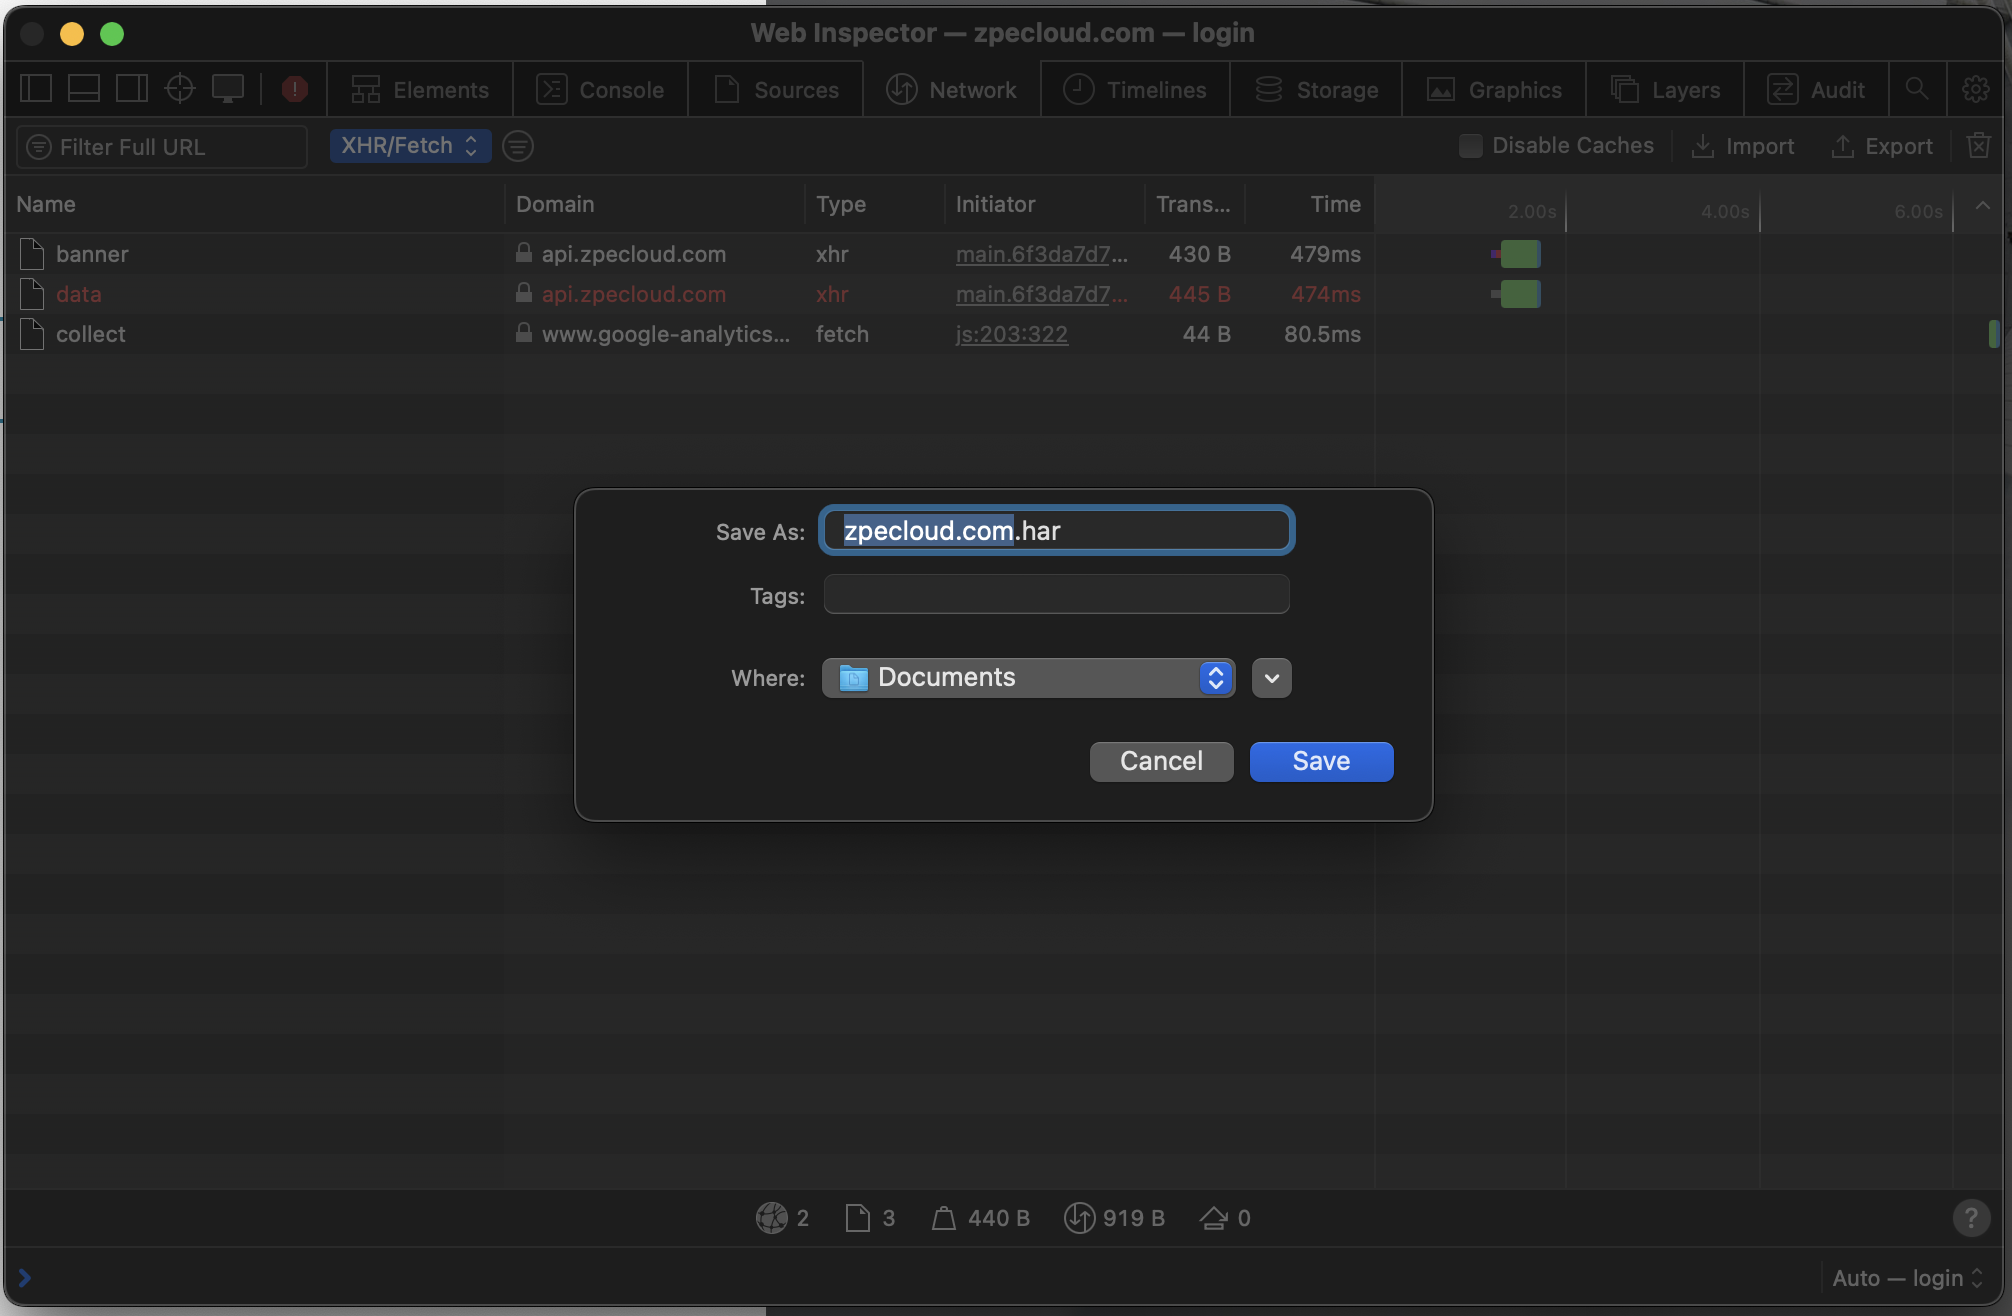
- Once you have captured the necessary activity, click the Export button in the top-right corner of the Web Inspector's Network tab (it looks like a box with an arrow pointing up).
- A "Save As" dialog will appear. Choose a name and location for your file, and click Save. The file will be saved with a .har extension.